The exact reasons and pathogenesis of obesity are still not fully understood. However, many factors contribute to obesity, such as lack of physical activity; increased consumption of fast food; stress; genetic predisposition; and hormonal disorders including the hormones involved in food intake regulation and maintenance of body weight, such as leptin, ghrelin, insulin, and adiponectin.12–15
Ghrelin is a 28-amino acid appetite-stimulating peptide that is secreted mainly by gastric mucosal X-cells.16 Ghrelin is also released by many other central, as well as peripheral, tissues, including the hypothalamus, pituitary gland, intestinal epithelium, pancreas, liver, and adipose tissue.17 Ghrelin has two forms, acyl ghrelin and des-acyl ghrelin (DAG). DAG is the predominant circulating form, contributing 90% of the total ghrelin. Ghrelin exerts its functions by acting on the growth hormone secretagogue receptor 1 α (GHS-R1α), promoting growth-hormone release and other ghrelin functions.18 Ghrelin has many other functions including its role in energy homeostasis and maintenance of body weight by promoting food intake, energy conservation and fat deposition.15–17 Studies have reported a negative correlation between ghrelin levels and body weight,19 and an increase of ghrelin level during fasting and upon weight loss, supporting the role of ghrelin in the maintenance of body weight.20, 21 Studies have also reported an association between the decrease in ghrelin level with insulin resistance and the development of type II diabetes in obese subjects.22,23
It has been reported that ghrelin promotes angiogenesis and regeneration of ischaemic cardiac cells.24,25 Ghrelin was also reported to promote gluconeogenesis during hypoglycaemic conditions.26,27 In addition, it plays a role in promoting muscle cell proliferation and differentiation.28 This brings to attention the possible use of ghrelin level as a screening test for insulin resistance and other obesity-associated complications, such as cardiovascular diseases.
The current study aimed to measure salivary ghrelin levels in healthy adult males with variable body mass index (BMI). We chose to measure ghrelin levels in saliva as studies have shown a significant correlation between salivary and serum ghrelin levels in healthy obese and non-obese individuals.29–32 Thus, using saliva instead of serum for monitoring ghrelin levels should decrease the level of patient discomfort associated with blood tests. The study also aimed to investigate the relative contribution of body fat (total, visceral, and subcutaneous), muscle mass (total and regional), age, height and weight in predicting salivary ghrelin concentrations, as well as the possible use of simple anthropometric measures as predictors for the change in the salivary ghrelin levels in adult males. The study sample included only Malays and was confined to only males to avoid the confounding effects of race and gender on the salivary ghrelin levels. To our knowledge, this study is the first to investigate the correlation between the salivary ghrelin levels and anthropometric measures, body fat distribution, and muscle mass in adult Malay healthy males.
Materials and methods
Ethical approval
The protocol for the study was reviewed and approved by the Research Management Committee at MAHSA University, Malaysia. All procedures were followed in accordance with the responsible committee on human experimentation and with the Helsinki Declaration of 1975 and subsequent revisions. Participants were briefed about the study objectives, expected outcomes, and the steps involved, and signed a written consent before starting.
Subjects
The study design involved a convenient sampling method; an announcement was open to all Malay males at MAHSA University who are aged 18–25 years old. Exclusion criteria included diabetes mellitus, hypertension or any cardiac disease, hormonal alterations, decrease or increase in body weight in the last 3 months of >5 kg, and the use of medications that could affect body composition.
Anthropometric measurements
The height of each subject was measured to the nearest 0.1 cm using a stadiometer. The Bioelectrical Impedance Omron Karada Scan HBF-362 (Omron Healthcare, Kyoto Prefecture, Japan) was used to measure body weight, BMI, total body fat %, resting metabolic rate in Kcal, visceral fat, whole-body subcutaneous fat %, regional subcutaneous fat % (in trunk), arms and legs, whole-body muscle mass % and regional muscle mass % (in trunk), arms, and legs. The bioelectrical impedance technique used to measure body composition with the Karada scan was proven to be correlated well with other methods such as dual-energy X-ray absorptiometry33,34 and even computed tomography.35 Body age, a measurement of biological age, was based on health and fitness level, calculated based on body mass, body fat, and resting metabolism.
Each subject was given clear and complete instructions on how to stand on the sensor platform of the Karada scan in an upright position, barefooted, and holding the fat analyser with arms extended. While standing, a measuring tape was used to measure waist circumference (WC) and hip circumference (HC) of each subject to the nearest 0.1 cm. WC was measured at the end of normal expiration at the midpoint between the lower costal border (tenth rib) and the iliac crest, while HC was measured at the maximum circumference around the buttocks. Waist-to-hip ratio (WHR) and waist-to-height ratio (WHtR) were then calculated. The participants were categorised into four groups based on the World Health Organization (WHO) classification of BMI: lean or underweight group, BMI <18 kg/m2; normal weight group, BMI 18–24.9 kg/m2; overweight group, BMI 25–29.9 kg/m2; and obese group, BMI ≥30 kg/m2.36
Saliva collection
An average volume of 5 mL fasting, non-stimulated saliva was collected from each subject through the drooling technique. All subjects were given proper instructions to ensure obtaining non-contaminated suitable samples of saliva. Each subject thoroughly rinsed his mouth with water before saliva collection. The samples were collected between 9 am and 12 pm. The samples were put in ice until being centrifuged at 3000 rpm at 4°C for 15 minutes. The supernatant was then divided into aliquots of 1 mL in Eppendorf tubes and stored at -80°C until analysis.37
Measurement of salivary ghrelin concentration
Salivary ghrelin was assessed by enzyme-linked immunosorbent assay (ELISA) using the commercial ELISA kit for human ghrelin (KA1863, Abnova, Taipei, Taiwan). Each sample was measured in duplicates.
Statistical analysis
The collected data were analysed using IBM SPSS version 26.0 (SPSS Institute, Chicago, IL, USA). The statistical difference among the groups in all parameters measured was tested using a one-way ANOVA test. For each group, multiple linear regression analysis was used to investigate the association between salivary ghrelin concentration as a dependent variable with age, height, weight, total fat, visceral fat, total subcutaneous fat, regional subcutaneous fat (in trunk, arms, and legs) total as well as regional muscle mass (in trunk, arms, and legs) as independent variables. Multiple regression analysis was performed to assess the predictive effect of anthropometric measures, including WC, HC, WHR and WHtR on salivary ghrelin concentrations for each group where salivary ghrelin concentration was the dependent variable. An alpha of p<0.05 was considered significant.
Results
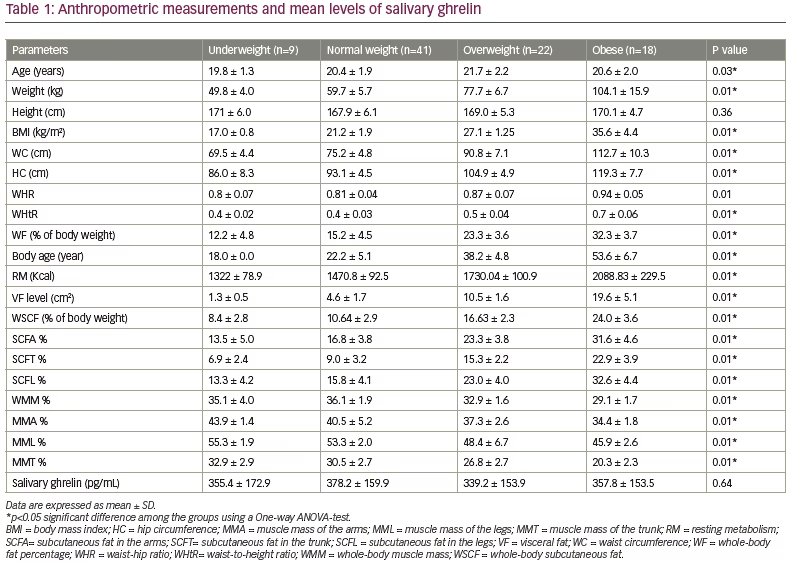
The study was a cross-sectional study that used a sample of 90 adult healthy Malay males aged 18–25 years old. Study participants were split into the following groups based on weight: underweight (n=9; 10.0%), normal weight (n=41; 45.6%), overweight (n=22; 24.4%) and obese (n=18; 20.0%) (Table 1). All of the measured parameters were found to be significantly different among groups, except height, and salivary ghrelin levels, which were found to be similar (Table 1).
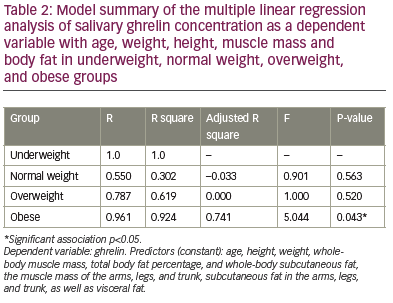
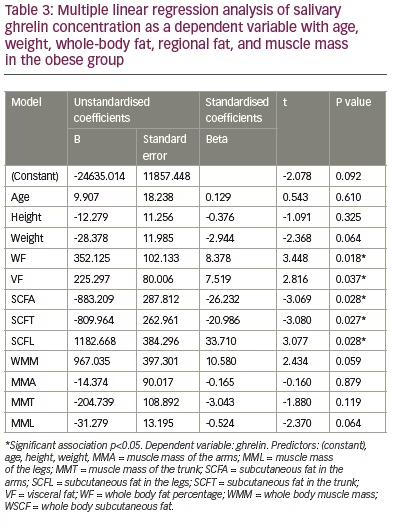
The multiple regression analysis between salivary ghrelin as a dependent variable with age, weight, height, total fat percentage, total and regional subcutaneous fat, total and regional muscle mass, and visceral fat as independent variables, revealed an absence of association between the salivary ghrelin level with any of these variables in underweight, normal weight and overweight groups. However, the same model of regression revealed a significant association between salivary ghrelin levels and the stated independent variables in the obese group (r=0.96, p=0.04) (Table 2). Table 2 also shows an adjusted R-square of 0.741 which refers to the proportion of variance in the dependent variable (salivary ghrelin level) which can be predicted from the independent variables (age, weight, height, total fat percentage, total and regional subcutaneous fat, total and regional muscle mass, and visceral fat) indicating that those variables can predict 74.1% of the change in the salivary ghrelin levels in the obese group. In the obese group, the results revealed a significant positive correlation between salivary ghrelin level with total fat percentage, visceral fat and subcutaneous fat in the legs – the higher the total body fat, visceral fat and subcutaneous fat in legs, the higher the salivary ghrelin level in obese healthy adult males. However, ghrelin levels negatively correlated with regional subcutaneous fat, in arms and trunk.
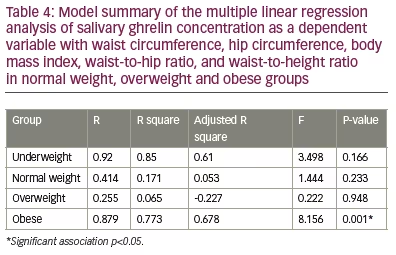
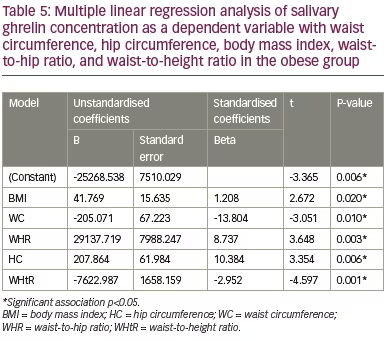
The analysis revealed an absence of association between the salivary ghrelin levels with age, height, body weight, total and regional muscle mass in the arms, trunk and legs (Table 3) in the group. Multiple linear regression analysis between salivary ghrelin levels as a dependent variable with BMI, WC, HC, WHR and WHtR revealed an absence of correlation between these variables and ghrelin levels in underweight, normal and overweight groups (Table 4). However, it revealed a significant positive correlation between ghrelin levels with BMI (p=0.02), HC (p=0.006) and WHR (p=0.003), respectively, and a significant negative correlation with WC (p=0.01) and WHtR (p=0.001) in the obese group (Table 5).
Discussion
Although ghrelin is known to be the hunger hormone that plays a significant role in increasing food intake, fat deposition, and weight gain, it also has many protective effects such as improving insulin resistance, promoting muscle cell proliferation and differentiation, and others.27 The monitoring of ghrelin level, especially in obese individuals, can help to predict insulin resistance and other obesity-related complications. The strong correlation between ghrelin levels in plasma and saliva has made saliva a good reliable, non-invasive, convenient alternative to serum measure of ghrelin levels.31,32 However, limited studies have been conducted to investigate the correlation between salivary ghrelin levels with anthropometric measurements in healthy adults with variable BMI.
This is the first study aimed at measuring salivary ghrelin levels among healthy adult Malay males and their association with different anthropometric measures in underweight, normal weight, overweight, and obese adults. The study findings revealed a significant difference among adult males with different BMI categories in most of the measured variables: body weight; age; resting metabolism; total body fat; visceral fat; total subcutaneous fat; subcutaneous fat in arms, trunk and legs; total muscle mass; and regional muscle mass of the arms, trunk, and legs. There was no significant difference in salivary ghrelin levels and height. This may reflect the importance of height in ghrelin level variation.
The absence of any significant difference in salivary ghrelin levels among groups of different BMI categories found in this study is in line with a study conducted in Germany by Benedix et al., which compared serum and salivary ghrelin levels among healthy controls, morbidly obese, and patients with carcinoma, and reported that salivary ghrelin levels did not differ among the groups.31 This can be explained by the tight physiological regulation of the ghrelin levels that involves, not only changes in body composition, but also many central and peripheral signals such as fasting blood glucose level, insulin, leptin and others.17 This was also reported in a study by Wadden et al., which found that serum-acylated ghrelin levels were the same in normal weight, overweight, and obese men at baseline.38
Although body age; weight; total fat; visceral fat; total and regional subcutaneous fat in arms, trunk and legs seem to be of lower significance in predicting salivary ghrelin levels in underweight, normal weight and overweight groups, they were able to predict 74.1% of the changes in salivary ghrelin levels in obese individuals reflecting the significance of these parameters in predicting ghrelin-level changes in obese subjects. Our findings revealed that whole fat, visceral fat and regional subcutaneous fat were more important in determining ghrelin levels in saliva of obese adults than muscle mass. The significant correlation between salivary ghrelin levels and visceral fat reported in our study is in agreement with a previous study conducted in Denmark, 2009, which reported that visceral fat mass was a strong predictor of basal ghrelin concentrations and also attenuated the suppressive effect of insulin on ghrelin concentrations in obese premenopausal women.39
The present study also revealed the significant effects of the simple anthropometric measures, BMI, WC, HC, WHR and WHtR, in predicting the changes in salivary ghrelin levels in obese healthy adults. The positive correlation between salivary ghrelin levels and BMI reported in our study among obese participants concurs with a study conducted among Chinese children and adolescents.40 However, it differed from the results of a study conducted in Germany, which reported a negative correlation between BMI and salivary ghrelin levels.41 This difference may be due to different sample sizes, study groups and study design. Although WC is a simple anthropometric indicator of abdominal obesity, it has its limitation in assuming the same cut-off point for individuals with different statures, since they also present unequal body proportions.42
Studies have shown the superiority of WHtR in comparison with other anthropometric measures in screening for obesity-related complications.43,44 The present study revealed a significant negative association between salivary ghrelin levels with both WC and WHtR and a positive correlation with HC and WHR. This is in agreement with a previous study conducted among Iranian adolescents by Heshmat et al. 2016,45 and partially in agreement with the results of a study conducted by Stepien et al., in Poland, which revealed a non-significant positive correlation with WHR in insulin-sensitive obese patients. However, in the insulin-resistant group of Stepien’s study, ghrelin was not significantly correlated negatively with WHR.46 These results indicated that the association between ghrelin levels and anthropometric measures are greatly affected by insulin resistance, as evidenced in a meta-analysis by Zhang et al. on the association between circulatory ghrelin and obesity-associated insulin resistance and concluded a negative correlation between ghrelin level and insulin resistance.47
The current study limited the assessment of ghrelin levels to saliva based on the pieces of evidence available on its reliability. The small study sample size, limited age range of subjects, the inclusion of only one race. all the participants were from the same location and were all males limit the generalisability of these results.
More studies are recommended to combine measuring ghrelin levels in saliva and plasma to investigate its correlation with body fat and muscle mass. Further studies are also needed to assess the difference between males and females in ghrelin levels and to measure serum levels of glucose, insulin, and lipid profile in correlation with salivary as well as serum ghrelin levels in obese individuals.
Conclusion
The present study found that salivary ghrelin levels did not differ among healthy adult Malay males with a wide range of BMI. BMI, WC, HC, WHR and WHtR are good predictors of salivary ghrelin levels in healthy obese adults but not in normal or overweight adults. The higher the WC and WHtR, the lower the salivary ghrelin levels in obese adults. The findings of this study can be applied to a clinical setting, allowing healthcare professionals to use anthropometric measurements, such as WC and WHtR, as a method of screening to predict ghrelin levels in obese males. This can allow the possible mitigation of the development of obesity-related complications. However, these measures should be applied with caution when dealing with patient populations outside of that included in this study.


