The growing epidemic of type 2 diabetes mellitus (T2DM) in India and the associated irreversible micro- and macro-vascular complications cause premature morbidity and mortality.1 ‘KgA1c paradox’ (Kg represents weight reduction; A1c represents glycaemic control) is now assuming significance in view of the greater tendency for Indians to develop insulin resistance, adiposity and cardiovascular diseases.2 Conventional oral antidiabetic agents act by modulating insulin secretion or response at the tissue level. The weight gain associated with some of the current antidiabetic agents diminishes their benefits to glycaemic control, and this poses a challenge in the management of T2DM.3
Sodium-glucose cotransporter-2 inhibitors (SGLT2i) block glucose absorption in the proximal tubule of the kidney, thereby improving glycaemic control.4 The metabolic adaptations subsequent to calorie deficit result in net weight loss, even in combination with insulin, sulphonylureas (SU), and pioglitazone. In addition, SGLT2i are reported to have low risk of hypoglycaemia and beneficial effects on blood pressure (BP) and cardiovascular outcomes.4
Currently, three approved SGLT2i, canagliflozin (C), dapagliflozin (D) and empagliflozin (E), are available in India. In 2016, an Indian prospective analysis found significant reduction in mean glycated haemoglobin (HbA1c) level (1.0±0.2%) after 3 months of treatment with SGLT2i; though none of the patients achieved HbA1c target.5 However, long-term studies with SGLT2i in India have shown a higher proportion of patients achieved HbA1c target.6–8
Although essential for evidence-based treatment decisions, comparative real-world data on efficacy and safety among different SGLT2i are not currently available. This retrospective analysis examines the characteristics of patients, and changes in glycaemic and metabolic profile after initiating SGLT2i treatment in routine clinical care.
Materials and methods
Study setting
This outpatient urban facility, located in North East India, is dedicated to patients with endocrine and metabolic disorders.
Prescription of SGLT2i
The facility followed the contemporary national/international norms and guidelines for selecting patients with T2DM for prescription of SGLT2i. Patients were not prescribed SGLT2i if they had any of the following or any other contraindication as mentioned in the prescribing information for each agent: diabetic ketoacidosis, acute coronary event in preceding 6 weeks, acute or chronic metabolic acidosis, history of urinary tract infection (UTI), renal dysfunction (serum creatinine ≥1.5 mg/dL for males and ≥1.4 mg/dL for females; estimated glomerular filtration rate (eGFR) <60 ml/min/1.73m2) or receiving renal replacement therapy, pregnancy, hypersensitivity to SGLT2i or type 1 diabetes.
Study design and record selection
This retrospective study reviewed the electronic records of people diagnosed with T2DM who were prescribed SGLT2i (C, D or E), between 1 January 2016 and 31 December 2016. Informed consent was not obtained as anonymised pooled data was used for this study. Records of patients were considered appropriate for inclusion in the study if they were aged ≥18 years, fulfilled the requirements of T2DM diagnosis criteria and had received SGLT2i (C, D or E) either as monotherapy or in combination with other antidiabetic medications, and whose follow-up records were available at least until 35 weeks after the first prescription of SGLT2i. The study also included those patients who switched to other SGLT2i within the first 12 weeks of the initial prescription and remained on the later SGLT2i during the entire follow-up period. Switching over from one agent to another was at the discretion of the treating clinician and primarily influenced by its efficacy, tolerability and adverse effects.
Records review
Demographic and clinical parameters were collected for each eligible patient. Demographic parameters included age, gender, weight, height, duration of diabetes, waist circumference (WC), body mass index (BMI), pulse, systolic blood pressure (SBP) and diastolic blood pressure (DBP), low-density lipoprotein-cholesterol (LDL-C) and eGFR calculated by modified renal disease diet method. Characteristics of T2DM included the year of diagnosis, HbA1c and fasting plasma glucose (FPG), as well as postprandial plasma glucose (PPPG). Blood samples for FPG test were obtained after 8–12 hours of overnight fasting, while sample for PPPG was collected exactly 2 hours after the meal. Both FPG and PPPG were measured using the hexokinase method on an autoanalyzer (COBAS INTEGRA 400 plus analyzer; Roche Diagnostics Ltd, Rotkreuz, Switzerland). HbA1c was performed by the immunoturbidimetry method. Treatment details included class, active pharmaceutical ingredient and date of prescription. Details on comorbidities (defined as chronic diseases requiring long-term treatment) and concurrent medications were also collected. Discontinuation was defined as a gap of at least 30 days between the end of the first prescription (based upon fill date and days supplied) and the fill date for a subsequent prescription.
Statistical analysis
All data extracted were analysed using the Statistical Package for Social Sciences (SPSS) software version 17.0 (SPSS, Chicago, Illinois, USA). The level of significance was set as 0.05 and the desired power of the study was 80%. Normally distributed parameters were expressed as mean ± standard deviation, and non-normally distributed parameters were expressed as median and range. Student t-test and one-way analysis of variance were used to compare continuous variables between two groups, or across more than two groups. The Chi-square test was used to compare categorical variables across all the groups.
Results
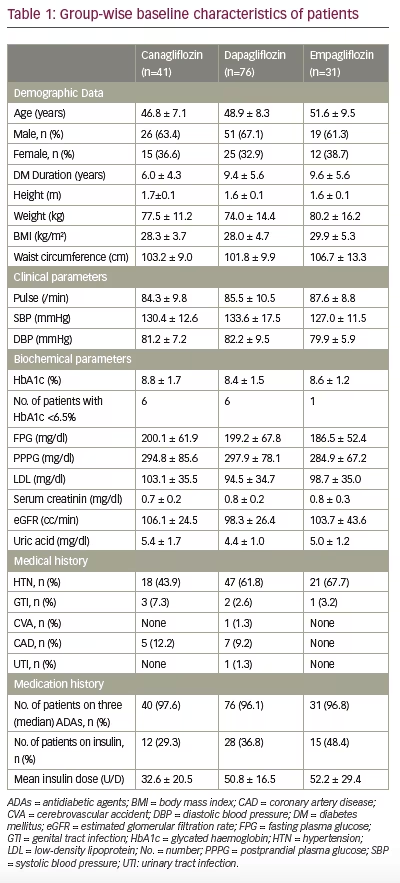
A total of 148 patients were enrolled in the study, of whom 96 (64.8%) were male and 52 (35.2%) female. The median follow-up duration was 48 weeks (interquartile range, 35–64 weeks). Only single strength for all three SGLT2i was identified during pharmacy records review. Patients were divided into three subgroups: C (100 mg), D (10 mg) and E (10 mg), with each group having 41, 76 and 31 patients, respectively. The age of subjects across subgroups ranged from 28 to 66 years. Hypertension was present in 58.1% of patients, while cardiac disorders were reported in nearly 8.1%. There were no clinically meaningful differences between the groups in the baseline characteristics (Table 1).
Therapy drop-out and crossover
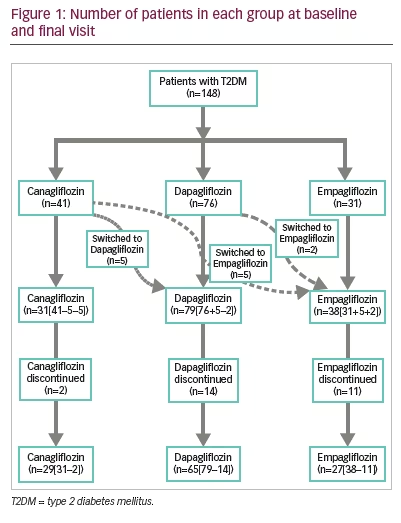
Of the 148 patients who were initially enrolled, 121 patients continued to receive SGLT2i until final follow-up; 29 in C, 65 in D and 27 in E, with tolerability being the most common reason for discontinuation (adverse events C [4.9%], D [18.4%], E [35.5%]) (Figure 1). Data from patients who switched to other SGLT2i (C [24.4%], D [2.6%]) are not presented here.
Glycaemic control
Glycated haemoglobin
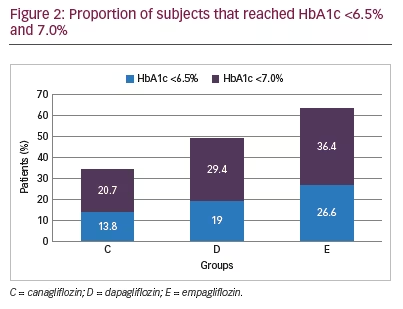
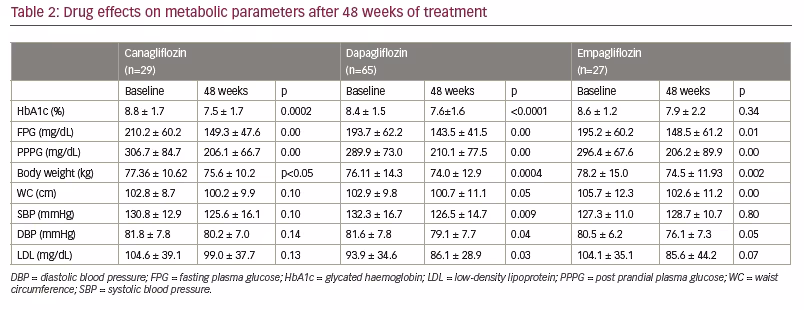
Mean HbA1c was 8.8%, 8.4%, 8.6% in groups C, D and E, respectively at baseline. Over a period of 48 weeks, the greatest reduction in HbA1c was noted in C (1.3%; p=0.0002) followed by D (0.9%; p<0.0001) and E (0.7%; p=0.34), respectively (Table 2). Those who discontinued SGLT2i had higher mean HbA1c levels at final follow-up (10.0% ± 1.0 for C, 8.1% ± 2.1 for D and 8.5% ± 2.5 for E). The proportion of patients who achieved HbA1c ≤6.5% was 13.8%, 19.0% and 26.6%, and those achieving HbA1c ≤7.0% were 20.7%, 29.4% and 36.4% in C, D and E respectively (Figure 2). Adjusted mean changes in HbA1c and target achievement among treatment groups was not significant.
Fasting plasma glucose
Mean FPG (mg/dl) significantly decreased from 210.2 ± 60.2, 193.7 ± 63.2 and 195.2 ± 60.2 at baseline to 149.3 ± 47.6, 143.5 ± 41.5 and 148.5 ± 61.2 in the C (p=0.00), D (p=0.00) and E (p=0.01) groups, respectively (Table 2). A higher mean value of FPG was reported in patients who discontinued SGLT2i (200 ± 26.9 for C, 189.6 ± 99.7 for D and 165.1±55.0 for E). No significant differences were observed among treatment groups at week 48 (p=0.88 for C versus D; p=0.80 for C versus E; p=0.94 for D versus E).
Postprandial plasma glucose
Mean PPPG (mg/dl) showed a significant reduction from 306.7 ± 84.7, 289.9 ± 73.0 and 296.4 ± 67.6 at baseline to 206.1 ± 66.7, 210.1 ± 77.5 and 206.2 ± 89.9 in C (p=0.00), D (p=0.00) and E (p=0.00) groups, respectively (Table 2). Mean PPPG levels were high in those who had discontinued SGLT2i (312.5 ± 0.7 for C, 272.4 ± 112.8 for D and 241.8 ± 73.5 for E). No significant differences were observed among treatment groups at week 48 (p=0.87 for C versus D; p=0.82 for C versus E; p=0.99 for D versus E).
Metabolic and cardiovascular markers
Weight reduction
The greatest and most significant weight loss of 3.7 kg was noted in group E (p=0.002), followed by a 2.1 kg and 1.7 kg loss of weight by the D (p=0.0004) and C (p<0.05) groups, respectively (Table 2). No significant differences were observed among treatment groups at week 48 (p=0.92 for C versus D; p=0.71 for C versus E; p=0.58 for D versus E).
Waist circumference
Waist circumference (WC) values showed a significant reduction from 102.9 ± 9.8 to 100.7 ± 11.1 in D group (p=0.05) and from 105.7 ± 12.3 to 102.6 ± 11.2 in E group (p=0.00). The greatest but non-significant reduction in WC was noted in the C group (102.8 ± 8.7 to 100.2 ± 9.9; p=0.10) (Table 2). Mean change in WC was not significant among those who had discontinued SGLT2i. No significant differences were observed among treatment groups at week 48 (p=0.99 for C versus D; p=0.52 for C versus E; p=-0.55 for D versus E).
Body mass index
Over a period of 48 weeks, body mass index (BMI) significantly (p<0.05) reduced in all treatment groups except group C (p=0.06) (Table 2). No significant differences were observed between adjusted mean change in BMI among treatment groups at week 48 (p=0.93 for C versus D; p=0.60 for C versus E; p=-0.52 for D versus E).
Blood pressure control
At baseline, more than 45% of patients were prescribed with antihypertensive drugs to achieve optimal BP control (C, 46.3%; D, 57.9%; E, 71.0%). After 48 weeks of SGLT2i, the percentage of participants treated with antihypertensives decreased in group C from 46.3% to 41.4%, while it increased from 57.9% to 60.0% and from 71.0% to 85.2% in group D and E, respectively.
SBP (in mmHg) significantly reduced from 132.3 to 126.5 in group D (p=0.009), while no reduction and/or significant difference was found for group E (p=0.80), C (p=0.10) and those who discontinued SGLT2i, over a period of 48 weeks (Table 2). No significant differences were observed among treatment groups at week 48 (p=0.99 for C versus D; p=0.80 for C versus E; p=-0.85 for D versus E). DBP (mmHg) significantly reduced from 81.6 to 79.1 in group D (p=0.04) and from 80.5 to 76.1 in group E (p=0.05), while no significant reduction was found for group C (p=0.14) and for those who discontinued SGLT2i (Table 2). No significant differences in DBP were observed among treatment groups at week 48 (p = 0.98 for C versus D; p=0.87 for C versus E; p=-0.92 for D versus E).
Low-density lipoprotein-cholesterol
At baseline, almost half of the patients were prescribed with lipid-lowering medications to achieve optimal lipid control (C = 48.8%;
D = 51.3%; E = 61.3%). After 48 weeks of SGLT2i, the percentage of participants treated with lipid-lowering medications increased to 82.8%, 73.4% and 81.5% in C, D and E groups, respectively.
Group D showed a significant difference in absolute mean change from baseline in LDL-C (93.9 ± 34.6 mg/dl to 86.1 ± 28.9 mg/dl; p=0.03). However, no significant difference was noted in group C (104.6 ± 39.1 mg/dl to 99.0 ± 37.7 mg/dl; p=0.13) and group E (104.1 ± 35.1 mg/dl to 85.6 ± 44.2 mg/dl;
p=0.07) over a period of 48 weeks (Table 2). No significant differences were observed among treatment groups at week 48 (p = 0.99 for C versus D; p=0.82 for C versus E; p=-0.86 for D versus E).
Concomitant antidiabetic medications
Prior to starting SGLT2i, almost all patients (97.3%) were treated with one or more glucose-lowering agents. Metformin was most commonly prescribed >85%, followed by SUs (≈50%) in all the three SGLT2i groups. Moreover, the use of metformin increased from 85.4% to 100% in group C, 89.5% to 96.9% in group D and from 90.3% to 92.6% in group E, over 48 weeks. For SUs, the proportion of patients increased from 39.0% to 51.7% in group C, 35.5% to 47.7% in group D and from 35.5% to 48.1% in group E. At baseline, about 96% of patients were taking three antidiabetic medications to achieve optimal glycaemic control. After 48 weeks of SGLT2i, concomitant antidiabetic medications reduced from three to two in 70.7%, 81.6% and 87.1% of C, D and E, respectively. Number of patients dispensed with concomitant gliptins, reduced from baseline in both C (p=0.005) and D (p=0.03) over 48 weeks. No significant intra- and inter-group differences were noted in the change of other antidiabetic medications at week 48.
Effect on insulin
Over a period of 48 weeks, the proportion of patients (%) taking insulin therapy reduced from 29.3, 36.8 and 48.4 to 17.1, 27.6 and 38.7 in group C, D and E respectively, which was not statistically significant. However, significant differences were observed for adjusted mean change among two treatment groups; C versus D (p=0.04), D versus E (p<0.0001). At baseline, 37.2% of patients received insulin, as either a monotherapy or combination therapy, with mean doses of 32.6, 50.8 and 52.2 U/day in the C, D and E group, respectively. In group C, mean dose increased to 44.0, while it decreased to 45.1 in group D and to 43.3 units/day in group E, over 48 weeks.
Safety and tolerability
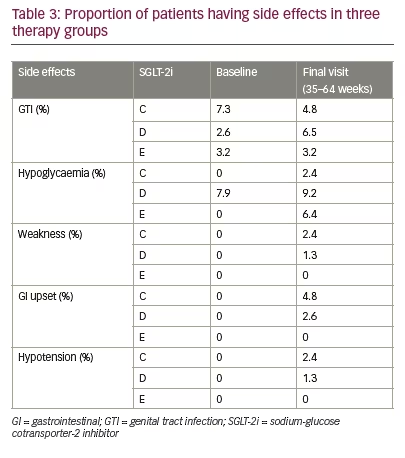
All the three SGLT2i were reasonably well tolerated and most of the side effects were benign and self-limiting. Table 3 provides number of episodes of side effects observed with each SGLT2i at baseline and final visit. Most common side effects noted were genital tract infection (GTI), UTI, hypotension, polyuria, hypoglycaemia, GI upset, dehydration, weakness and myalgia. At baseline, the mean eGFR (mL/min/1.73 m²) was 106.1 for C, 98.3 for D and 103.7 for E group, which improved over a period of 48 weeks in all the three groups (C 106.1 to 110.6; D 98.3 to 101.2; E 103.7 to 111.1 cc/min). No significant differences were observed among treatment groups at week 48 (p = 0.95 for C versus D; p=0.98 for C versus E; p=-0.97 for D versus E).
Three bone fractures were noted in total, with two in C (rib and tibia fracture secondary to road traffic accident and injury, respectively), and one in D (left hand due to road traffic accident) group.
Discussion
This single-centre retrospective study is the first experience from India indicating intra- and inter-group changes in efficacy, as well as safety/tolerability of three available SGLT2i (C, D or E) over 48 weeks of treatment. All three available SGLT2i showed significant reduction from baseline in mean FPG (C, p=0.00; D, p<0.00; E, p=0.01) and PPPG
(C, p=0.00; D, p<0.00; E, p=0.00) levels as well as in body weight (C, p<0.05; D, p=0.0004; E, p=0.002) with non-significant increase in the incidence of hypoglycaemia. However, significant change in mean HbA1c levels from baseline were seen only with C and D but not with E (C, p=0.0002; D, p<0.0001; E, p=0.34). Also, D and E but not C, showed significant change in mean LDL levels after 48 weeks of treatment (C, p=0.13; D, p=0.03; E, p=0.07). Inter-group changes in glycaemic and metabolic parameters among SGLT2i were not significant. All three SGLT2i were reasonably well tolerated and most of the side effects were benign and self-limiting.
The percentage of patients achieving HbA1c target (≤6.5% or ≤7.0%) was higher in group E than group C or D, though not significant. Mean HbA1c reductions were 0.7%, 1.3% and 0.9% with E, C and D (all significant) respectively, as an add-on to ongoing antidiabetic treatment. In 2017, Gupta et al. also found a higher proportion of E-treated patients achieving HbA1c target of 7% after 76 weeks of treatment.6 Glycaemic improvement and reduction in body weight have also been demonstrated with C, in the pooled analysis of four randomised, phase III studies (n=2,231) from the Indian population.7 The short-term real-world setting (n=9), had also given similar results.8 A study by Tamez-Perez et al. 2013 on SGLT2i showed an average HbA1c reduction of 1.0% for the C group and 1.1% for the D group,9 while Liakos et al. 2014 observed a mean reduction of 0.7% in group E,10 which is consistent with the results of our study. Real-world evidence from India has also shown reduction of 1.0% in mean HbA1c after 3 months of SGLT2i therapy.5,6,11,12
SGLT2i reduced weight up to 4.7 kg in phase II and III clinical trials when administered as a monotherapy or as an add-on therapy to metformin, SU, or insulin over study periods ranging from 4 to 104 weeks.13 Rosenstock et al. 2013 thought it was due to urinary glucose excretion and mild osmotic diuresis.14 However, body composition analysis revealed that reduction in body weight was mostly due to loss of body fat mass, rather than a loss of fluid or lean mass.15–17 The effect of C, D and E on body weight in our study is consistent with previous results showing similar weight loss (C, 1.7; D, 2.1; E, 3.7 kg) from baseline.9 The reductions in BMI also paralleled the weight changes (1.0 kg/m2with C, 0.5 kg/m2 with D and 2.1 kg/m2 with E) in our study. Davies et al. observed an approximately similar reduction in BMI with C (100 mg).18
WC, in our study, was reduced by about 3.0 cm with C, 1.0 cm with D and 4.2 cm with E. The finding is consistent with the previous study showing about 2.1 cm reduction by C (300 mg).18 Bolinder et al. in 2013 observed a reduction of 5.0 cm with C over a follow-up of 102 weeks. A much longer follow-up period (48 versus 102 weeks) could be one of the causes of higher WC reduction observed in this study.19 In 2016, Neeland et al. reported about 1.3 cm reductions in WC with E, which is in contrast to our study showing 4.2 cm reduction with E.20 High WC at baseline could be the reason for this unexpected behaviour, however, further studies are needed.
Patients with T2DM are more obese with metabolic syndrome, and their requirements for insulin may be higher than that of patients with T1DM because of insulin resistance. In T2DM obese patients with multiple insulin injections per day, E10 and 25 mg for 52 weeks resulted in significant reductions in daily insulin dose as compared to placebo.21 We also found a decrease in daily insulin dose with group D and E, while group C led to increase of about 11.4 units in daily insulin dose. This may be attributed to treatment failure due to inadequate compliance and may not have been caused by duration of diabetes. A retrospective study by Gorgojo-Martínez et al. in 2017 observed that the addition of D to background GLP1-RA therapy resulted in insulin therapy drop from 48.6% to 38.8% after 1 year.22 Over 48 weeks, we also found a drop in the proportion of patients using insulin, with all three SGLT2i; though this was not significant.
It is known that patients treated with insulin are at a higher risk of hypoglycaemia, which can increase macrovascular events and mortality. A retrospective medical record review conducted by Filippas-Ntekouan et al. reported that SGLT2i do not increase the risk of hypoglycaemia even when co-administered with insulin, but a decrease in the dose of SUs may be needed.23 The results of our study also indicated that SGLT2i as an add-on therapy, achieved glycaemic control with non-significant increase in the incidence of hypoglycaemia.
More than 96.0% subjects in our study were taking three or more medications. Metformin was the most frequently prescribed drug followed by glimepiride to these subjects. An observational study performed by Sharma et al. also reported metformin (85.6%) as the most frequently prescribed drug to diabetic patients.24 We also found dosage reduction in gliptins and increment in metformin during 48 weeks of treatment with SGLT2i. These dose adjustments could be a prescriber bias or preference for drug with established efficacy, as our facility is catering mostly to the uninsured and indigent population. It may also indicate physician preference of SGLT2i over gliptins as the third add-on after a combination of SU and metformin.
Although previous studies have shown reduction in both SBP and DBP with SGLT2i,25,26 we found more of an SBP-lowering effect than DBP with all the three studied SGLT2i. The reduction in BP may be due to concomitant antihypertensive agents along with weight loss, and possible effects of improved endothelial nitric oxide release.27 The EMPA-REG (NCT01131676), CANVAS (NCT01032629) and CVD-REAL (NCT02993614) studies have demonstrated the benefits of SGLT2i in CV outcomes; however, our study only examined the BP and no other detailed CV outcome markers.28–30
SGLT2i are reported to have an association with an increase in LDL-C.31 However, none of the SGLT2i in our study exhibited detrimental effects on serum LDL-C level. In contrast, a beneficial effect on LDL-C was observed. This may be due to temporal increase of concomitant statin therapy (C=82.8%; D=73.5% and E= 81.5%). Uric acid, a marker of metabolic dysfunction, was reduced (5.9–17.8%) by SGLT2i, with the effect being sustained for 2 years.19 However, in our study, serum uric acid was found to be elevated in both D and E groups. It has been opined that insulin co-prescription attenuates the beneficial effect of SGLT2i on uric acid.31 This could be the reason for the high uric acid levels in our study.
We found no significant change in eGFR With SGLT2i. This is consistent with recently published systematic review and meta-analysis of 40 randomised controlled trials (RCTs) (n=29,954 patients), which concluded that SGLT2 inhibition compared with placebo is associated with an initial decrease in eGFR followed by an increase and return to baseline levels in populations with renal impairment.33 In a pooled analysis of 17 studies, having populations without renal impairment, no significant change in eGFR was observed for SGLT2i in comparison with placebo (mean difference, 0.51 ml/min/1.73 m2; 95% CI: -0.69, 1.72; p=403).33
In our study, group D was associated with a higher incidence of GTIs. A recent meta-analysis conducted by Liu et al. reported a raw event rate of 4.7% GTIs (1,737 events among 36,569 patients with SGLT2i).34 SGLT2i have been associated with an increased risk of GTI, but future studies are warranted to confirm these findings.
The major limitation of the present study is its retrospective nature and small sample size. The study observed results only with single strength of all the three SGLT2i. However, to completely unravel the desired outcomes, clinical parameters should also be studied with high-strength dosing. Another important limitation was the use of SGLT2i as an add-on therapy to existing single/dual/triple antidiabetic therapy or even insulin. This makes it difficult to ascertain the independent effects of SGLT2i. Moreover, no strict criteria or guidelines were followed for prescribing C, D or E basis patient profile. Despite these limitations, the evidence suggests that the use of a SGLT2i appears to be a preferable option when combined therapy with insulin or other antidiabetic agents are required.
Conclusion
This retrospective study provides first-hand information on the ‘real-world’ medication-utilisation patterns for SGLT2i therapy. Overall intra-group changes in glycaemic and metabolic parameters were significant; however, inter-group changes among SGLT2i did not reach significance, thereby indicating a class effect of the efficacy and safety parameters. Prospective comparator studies on different dosing strengths and long term usage of SGLT2i are required to suitably delineate clinical benefits and safety issues.