The prevalence of diabetes continues to increase globally,1 and is projected to remain of importance to Sweden’s public health,2 given the higher risk people with diabetes face regarding disabling and/or life-threatening health problems and mortality.1,3 A recent estimate puts national prevalence at 7.0% (type 1 diabetes [T1D] and type 2 diabetes [T2D]); approximately 10% have T1D.1,4 Sweden is currently ranked number two internationally for incidence of T1D among children at 43.2 cases/100,000 in the population.1
Sweden faces a growing burden in diabetes treatment and management. Although this figure is for T1D and T2D combined, Sweden spends nearly US$8,000 per patient annually.1 A recent projection indicates that 940,000 patients will be affected by the year 2050.2 In addition to the direct costs of managing diabetes, healthcare costs are incurred in the management of short-term hypoglycaemic events and longer-term macro- and microvascular complications associated with poor glycaemic control.5,6 Indirect costs associated with lost productivity likewise impact the overall cost burden.1,7
All patients with T1D require daily insulin,1 yet while insulin usage helps reduce glycated haemoglobin (HbA1c), it is associated with complications such as increased hypoglycaemic events.8 Frequent glucose monitoring allows patients to manage their blood glucose levels,1,9 with self-monitoring of blood glucose (SMBG) as the current standard of care. However, many people fail to adhere to recommended testing.10–13 Impediments to SMBG adherence include discomfort associated with obtaining a blood sample, inconvenience of carrying testing kits, perceived social stigma, needle phobia and difficulty interpreting results.14–18 Additionally, SMBG provides limited data on glucose levels and variability, as it measures a single time point.19 This can create difficulties for clinicians to recommend changes to therapy. Although continuous monitoring may provide additional information, it is expensive and therefore not universally reimbursed and utilised.18,20
Flash glucose monitoring is an alternative to traditional blood glucose monitoring. In this approach, a sensor worn by the patient permits continuous monitoring of interstitial glucose. A reader can then be passed over the sensor at any time to obtain a current reading, trend arrow and data from the past 8 hours. FreeStyle Libre (Abbott Diabetes Care, Witney, UK), a flash glucose monitoring system, was recently tested in intensively insulin-treated T1D population in the IMPACT trial.
The IMPACT trial21 was a 6-month, multicentre randomised controlled trial of the flash monitoring system versus SMBG in adults with well-controlled T1D (HbA1c ≤7.5% [58 mmol/mol]) using multiple daily injection insulin therapy or continuous subcutaneous insulin infusion and testing glucose levels at least 10 times/week. The study found a 25.8% reduction in favour of flash monitoring in number of hypoglycaemic events (<70 mg/dL [3.9 mmol/L]) without changing HbA1c.21 Given potential clinical benefits of intervention, this study sought to assess the value of using flash monitoring instead of SMBG alone through cost-effectiveness evaluation in patients with T1D receiving intensive insulin treatment in Sweden.
Research design and methods
The present study was performed using the IQVIA Core Diabetes Model v9.0 (IQVIA CDM).
IQVIA Core Diabetes Model
The IQVIA CDM is a non-product specific internet application to assess long-term health outcomes and economic consequences of interventions for T1D or T2D. The underlying mathematical engine consists of a series of diabetes-complication sub-modules that combine Markov techniques with Monte Carlo simulation and run simultaneously to capture comorbidities and outcomes associated with treatments of interest. These submodules are permitted to interact and each patient profile is updated at the end of each 1-year cycle to account for events across all submodules. The model captures differences in life expectancy, quality adjusted life years (QALYs), costs, cumulative incidences of complications due to adverse event-related intervention effects as well as HbA1c levels and other physiological parameters that affect risks of major diabetes complications. The model has been published previously in detail and has been extensively validated against clinical and epidemiological studies.22,23
In the model, changes in physiological parameters (e.g. HbA1c, blood pressure, weight, lipid parameters) are entered and translated into long-term microvascular and macrovascular complications based on specific risk equations derived from landmark studies like the Diabetes Control and Complications Trial and its extension Epidemiology of Diabetes Interventions and Complications in T1D.24–32 Most important for this analysis, however, is the hypoglycaemia module that considers three severity levels as well as diurnal versus nocturnal status. Severe hypoglycaemic events may require third-party medical assistance (SHE2s) or third-party non-medical assistance (SHE1s). The model also considers non-severe hypoglycaemic events (NSHEs).
Analyses took a Swedish payer perspective, evaluating costs and effects over a 50-year horizon, intended to capture a lifetime (e.g. <1% of the full cohort will remain alive) from the age at model entry (approximately 43.7 years). Swedish non-specific mortality information derived from WHO was included.33 Costs and effects were discounted at 3%. All analyses were run with 1,000 patients for 1,000 iterations.
Model inputs
Baseline characteristics
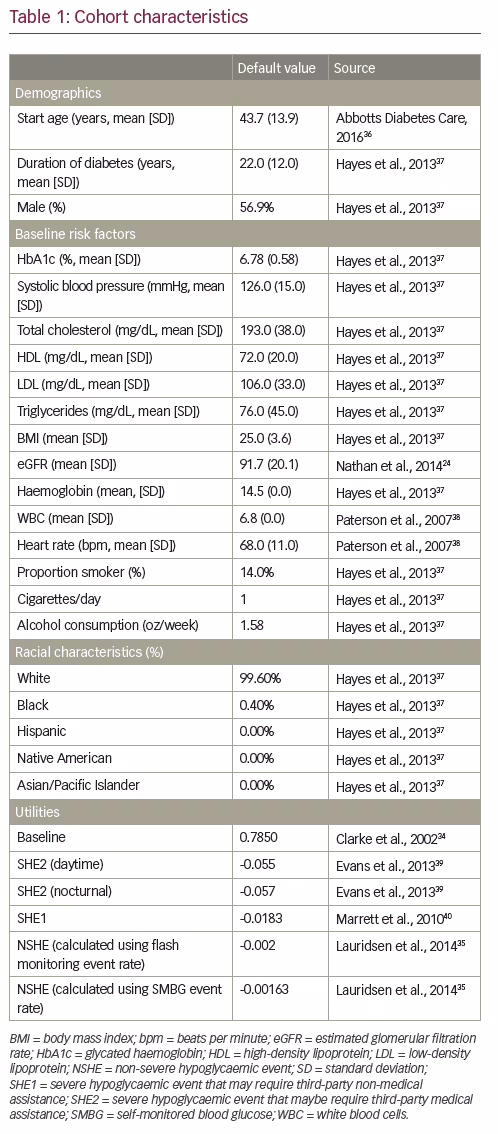
The model cohort was designed to represent the IMPACT trial population (Table 1).24,34–40 Some cohort characteristics were unavailable from IMPACT; published sources were used to supplement IMPACT cohort data with T1D population estimates.
Intervention effects
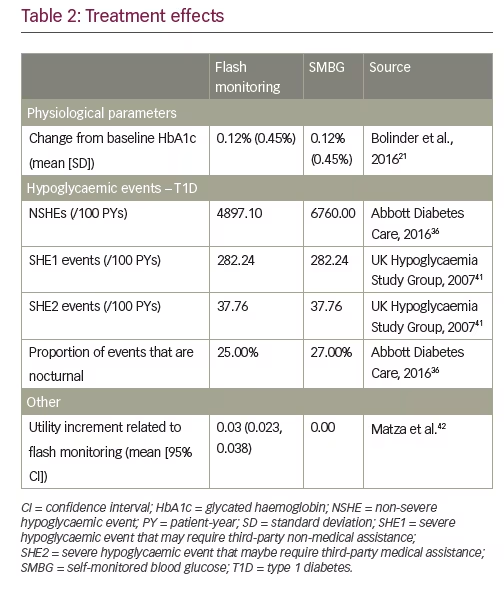
Intervention effects for T1D were based on data from IMPACT and captured in Table 2.21,36,41,42 No significant differences were seen in the evolution of HbA1c between the two treatment arms in the IMPACT study, so an HbA1c increase of 0.12% (standard deviation [SD] 0.45%); 1.32 mmol/mol [SD 4.95]) compared to baseline was included for both flash monitoring and SMBG.
NSHEs were populated using data from the IMPACT trial.36 The NSHE rate for the SMBG treatment arm was based on baseline symptomatic hypoglycaemia event data as a proxy for events below 70 mg/dL.43 The NSHE rate for the flash monitor arm was calculated by adjusting the baseline rate by percentage difference in events between SMBG and flash glucose monitoring over the study period (25.5% decrease in daytime and 33.2% decrease in nocturnal events).
Few SHEs were observed in IMPACT as the trial was not designed to assess severe events. Therefore, data from the UK Hypoglycaemia Study Group41 was used to inform the total rate of severe events (320/100 patient-years [PYs]); these were used as a proxy to align with ‘significant’ hypoglycaemic events as noted in current guidance (<55mg/dL).43 The proportion of severe events that are SHE2s was derived from the literature (11.8%),27 resulting in 282.24 SHE1 events/100 PYs and 37.76 SHE2 events/100 PYs. These values were assumed equivalent across both treatment arms.
Intervention-related resource utilisation
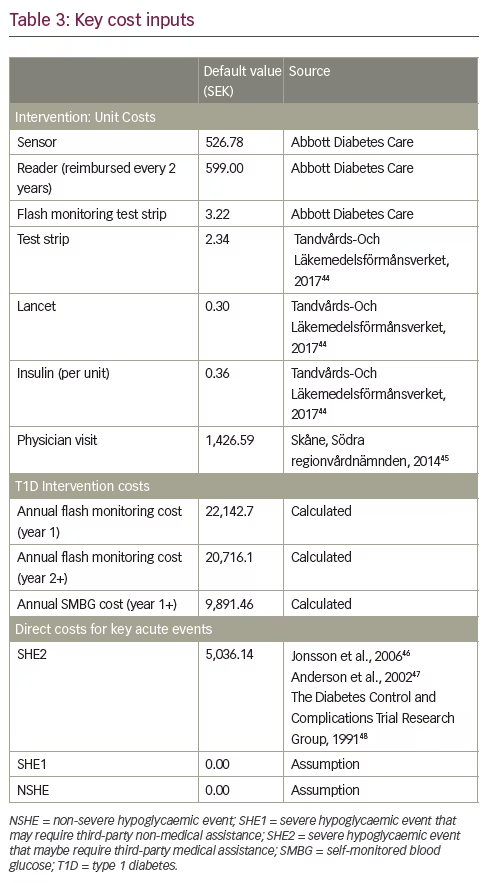
Intervention-related resource use was based on reported values from IMPACT. Patients using flash monitoring required 182.5 test strips/year, 267.4 lancets/year and 45.8 units of insulin/day. It was also assumed that flash monitoring patients require 26 sensors/year and an extra physician visit in year 1. Patients with SMBG used 1,971 test strips/year, 657.6 lancets/year and 38.4 units of insulin/day.
Unit costs
Table 344–48 shows key cost inputs for the analyses, including intervention-related unit costs, total intervention costs, and costs for key acute events; Appendix 1 shows the full list of costs used in the analyses. Intervention-specific consumables reflect lowest-cost items available from Tandvårds-Läkemedelförmånsverket (TLV).44 Costs were inflated as needed to 2016 using the consumer price index for Sweden from the Organization for Economic Co-operation and Development.49
Utilities
Utilities and disutilities (Table 1;24,34–40 Appendix 2) are derived from published literature, with the baseline diabetes utility34 and complication-related values obtained from T2D populations,50 as it is not expected that quality of life for complications would differ based on diabetes type. For hypoglycaemia, literature shows that patients experience relatively high disutilities for initial non-severe events; yet, the disutility per event diminishes as frequency increases.35 Therefore, the IQVIA CDM automated incorporation of the Lauridsen approach to estimate NSHE disutility was utilised. A treatment-related utility benefit of 0.030 was applied to the flash monitor arm based on a recent time trade off (TTO) study.27 We explored this concept further with sensitivity analyses.
Analyses
The base case analysis compared flash monitor use against SMBG use, reflecting the intervention effects summarised in Table 2.21,36,41,42In addition to the base case, scenario analyses (summarised in Table 4) explored the impact of key model assumptions. Note that due to the comprehensive nature of the IQVIA CDM, parameters are too numerous to perform systematic univariate sensitivity analyses; however, scenarios tested key inputs, assumptions, and alternate data sources to provide evidence-based clarity on sensitivity to each of these components.
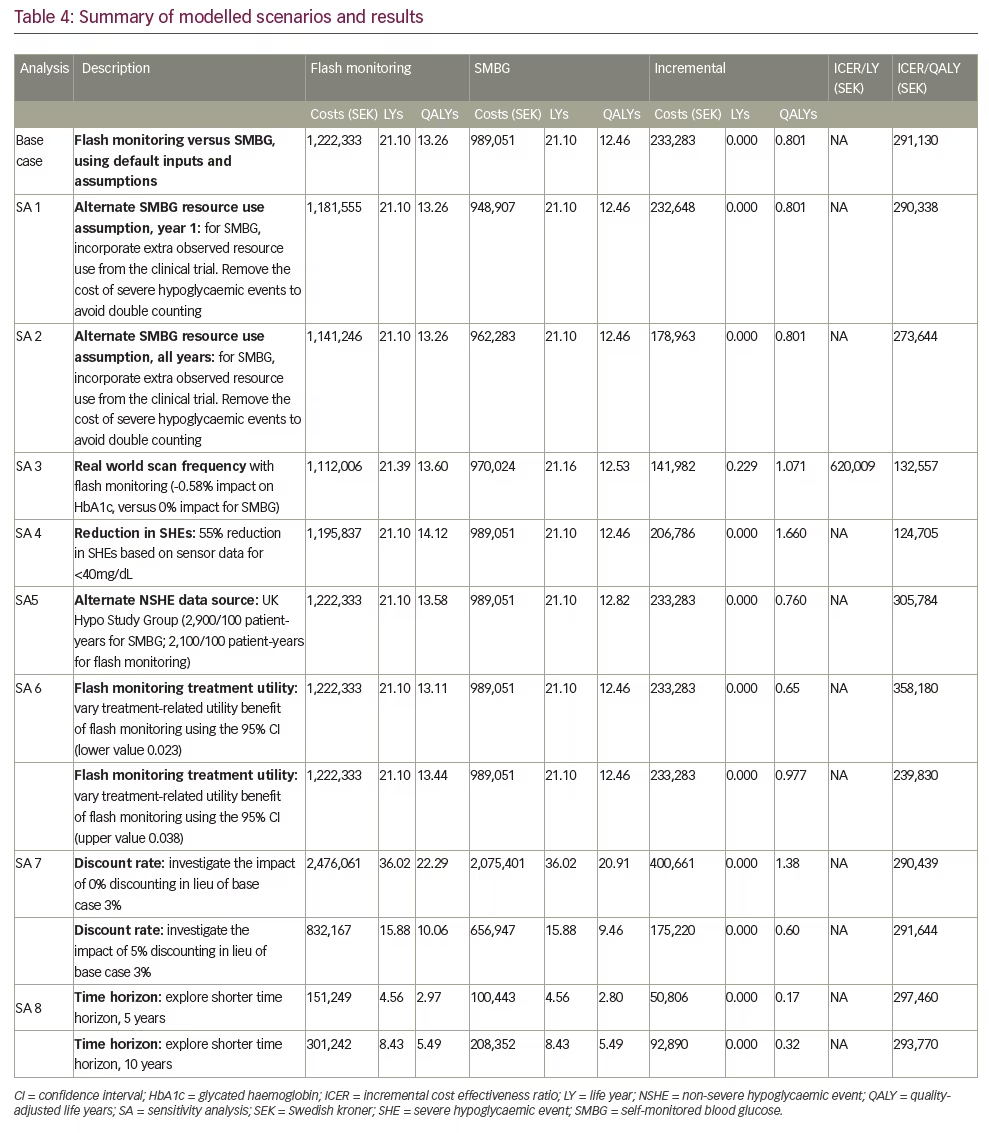
Two scenarios test the impact of incorporating resource utilisation observed in the trials. In these scenarios, trial-based use of resources such as ambulances, emergency room visits and hospitalisation were implemented. Based on the hypothesis that some of these differences may have been driven by hypoglycaemic events, assigned hypoglycaemic event costs were removed from the model. In the first scenario, these resources were assumed to apply in year 1 only (as in the trial), and the second analysis explored continued differences over the model horizon.
Another scenario explored the potential impact on cost-effectiveness due to real-world intervention effect, rather than trial-based values. Specifically, cross-sectional data from over 50,000 flash monitoring readers shows an average of 16 scans/day,51 which can be compared to a population average for patients with T1D of 5–6 tests/day.52 Miller et al. have shown an association in patients with T1D between number of daily blood glucose tests and HbA1c levels,52 which is replicated in flash monitor user data. Therefore, exploratory analysis, based on assuming that high scan frequency leads to HbA1c improvements, evaluated the potential impact of a higher scan rate on cost-effectiveness. Data revealed that patients who scan 16 times/day versus those who only scan 5–6 times/day have 0.58% lower HbA1c. For the purposes of this exploration, this value was applied as a potential decrease in HbA1c due to flash monitoring, compared to 0% decrease for SMBG.
Additional scenarios explored the impact of varying the flash monitoring utility benefit (95% confidence interval [CI] 0.023, 0.038), an alternate set of data (UK Hypo Study Group)41 to inform NSHE rates (2,900/100 PYs for SBMG; 2,100/100 PYs for flash monitoring when applying the IMPACT-based reduction due to flash monitoring), 50% decrease in SHEs based on observed decrease in sensor measurements under 40 mg/dL, and varied discount rates and time horizons.
Results
Disaggregated results, including total costs and QALYs per strategy, are reported in Table 4. In the base case analysis, total direct medical costs for flash monitor use were SEK1,222,333 compared to SEK989,051 for SMBG use in T1D. These costs aligned with an equivalent life expectancy of 21.1 life-years (LYs) due to non-differential survival effect, but with a total of 0.80 additional QALYs for flash monitor patients (13.26 versus 12.46 SMBG). The corresponding incremental cost-effectiveness ratio (ICER) is SEK291,130/QALY. Patients with T1D with flash monitoring experience 687 fewer NSHEs than those with SMBG; the cost per NSHE averted was SEK339.56.
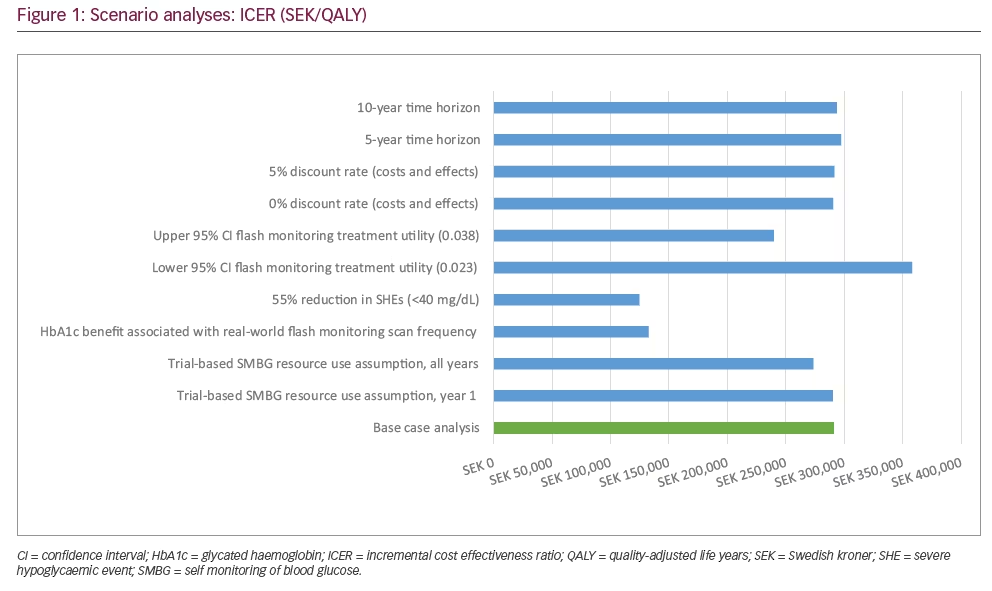
Key scenarios evaluated to test the impact of assumptions or input values are reported in Table 4 and Figure 1. The most favourable ICERs – more than 50% lower than base case – reflect improved intervention effects. In the first case, reducing severe hypoglycaemia by 55% according to sensor-based reductions in 40 mg/dL events led to an ICER ofSEK124,705/QALY. Potential HbA1c improvement led to another similarly low ICER (SEK132,557/QALY); this ICER was based on exploring the potential relationship between high daily scan frequency found to occur in real-world use of the flash monitor and HbA1c level. Conversely, the highest ICER was associated with the lower 95% CI for health state utility benefit due to flash monitor use, which impacts quality-adjusted survival. Although the model is thus shown to be most sensitive to intervention effects on HbA1c, severe hypoglycaemia and monitoring-related health utility, all ICERs remained under SEK400,000/QALY.
Discussion
This is the first cost-effectiveness analysis to evaluate a flash monitoring system. Results demonstrate that use of flash monitoring is associated with a modest impact on diabetes-related costs and can be considered cost-effective compared to current standard of care (SMBG) in intensive insulin users with T1D. In clinical trials, use of the system has been shown to reduce the number of hypoglycaemic events without raising HbA1c across populations and may increase awareness of a patient’s glucose profile, potentially improving management of their condition. Although no survival difference is expected based on default intervention effects, meaningful QALY differences accrue over a lifetime horizon. These differences are due to offsetting hypoglycaemic events, and to a greater extent, to nearly eliminating the finger-pricking associated with SMBG, which has been shown to translate to a health utility improvement.51
When exploring additional scenarios, results are generally robust to evidence-based alternate assumptions. Model results may be sensitive to additional clinical benefits (e.g. HbA1c improvement or reduction in SHEs) as well as decrease in health utility associated with flash monitoring (which impacts QALY outcomes). However, ICERs remaining under willingness-to-pay ranges for Sweden for all scenarios. Although Sweden does not publish an explicit cost-effectiveness threshold, interventions have been accepted with an average ICER of €36,000/QALY (which is approximately SEK400,000/QALY) and publications note an ‘informal threshold’ of SEK500,000.53,54 Treatments for more severe conditions have been considered acceptable up to the much higher amount of €90,000/QALY (SEK827,000 /QALY).54,55
A number of limitations for this study must be acknowledged. The analysis assumes that NSHEs are not associated with the occurrence of other more severe events like severe hypoglycaemia, myocardial infarction and mortality. However, in the Predictable Results and Experience in Diabetes through Intensification and Control to Target: An International Variability Evaluation (PREDICTIVE) study, a high frequency of NSHEs was significantly associated with the occurrence of SHEs.56 The base case analysis also does not assume an explicit link between hypoglycaemic unawareness and downstream increased risk of SHEs. Given the extent of previously unrecognised hypoglycaemia detected by flash monitoring in the IMPACT trial, use of the flash monitoring system to better understand personal glucose trends may constitute an intervention to potentially help avoid hypoglycaemic unawareness and thereby reduce the risk of SHEs. Thus, reduction in SHEs was explored in scenario analysis.
Additionally, the analysis may not capture all health outcomes. For example, the model captures risk of cardiovascular disease based on HbA1c, lipid levels, blood pressure, comorbidities and body mass index. However, recent evidence suggests that people experiencing hypoglycaemic events may be at increased risk of cardiovascular disease.57–58 Although baseline characteristics in those T2D studies differ from our analysis, it raises the possibility that this analysis underestimates the value of offsetting hypoglycaemic events.
The main clinical data and patient characteristics for each analysis are taken from a 6-month trial of patients with well-controlled T1D, and may not exactly represent real-world effects of the flash monitor system or represent the patient population using flash monitoring in the real world. However, there were no protocol-mandated monitoring or adjustments to therapy, and default intervention effects may underestimate total benefit. This is based on recent evidence suggesting substantial clinical benefit to flash monitoring in real-world use; in addition to the cross-sectional real-world data that underpins this study’s HbA1c improvement scenario analysis,51 a recent meta-analysis has shown a similar level of HbA1c improvement (0.56% overall), with greater improvements in patients with higher baseline HbA1c levels upon initiating flash glucose monitoring use.59
Our analysis simplified the treatment pathway faced by patients by assuming glucose monitoring and insulin use do not change over time. In the absence of data, typical modelling practice is to assume no difference associated with treatment; therefore, any insulin change applying to both strategies equally would not alter the conclusions of this study.
Additionally, current utility values may not exactly reflect the quality-of-life impact of using flash monitoring. The intervention-associated utility benefit, derived from a time trade-off study, assumed that flash monitoring offsets the need for SMBG blood tests performed on average three times/day.42 However, guidelines recommend testing 6–10 times/day, and IMPACT resource utilisation indicates that during the trial, SMBG users tested 5.4 times/day versus 0.5 times/day for flash monitoring users. This greater difference in test frequency may translate into a larger utility benefit. Conversely, the time trade-off study measured utilities for patients based on the assumption of three tests versus no tests; therefore, minimal concurrent testing may lower the cited benefit. Sensitivity analyses applying the 95% CI from the time trade-off study showed that using the lower estimate of utility gain still results in a cost-effective result. The disutility associated with NSHEs is assumed to reflect the diminishing effect of each event as they become more frequent, as has been shown in recent research.35 However, the average value per event applying this technique is much smaller than that used in prior economic analyses,60 and therefore the ICERs in this study are likely to be more conservative but also more realistic relative to other published values.
Despite the limitations, this study facilitates understanding of the potential economic value of using flash monitoring versus SMBG in T1D intensive insulin users. This analysis shows that improved hypoglycaemia outcomes and health utility benefit associated with flash monitoring may translate into economic value compared to SMBG, with incremental costs per QALY under acceptable willingness-to-pay thresholds. As results remained robust across scenario analyses, flash monitoring may be considered cost-effective in a Swedish population among T1D intensive insulin users.