The estimation of lipid parameters has traditionally been carried out in the fasting state, without definitive evidence to suggest that this is superior to assessing them in the post-prandial period in terms of predicting metabolic outcomes and cardiovascular risk.1 Post-prandial lipoprotein metabolism is believed to play a role in the development of atherosclerosis.2 Post-prandial dyslipidaemia may be a better predictor of the metabolic status of an individual. In the Women’s Health Initiative study, 4-hour post-meal triglyceride was the best predictor of cardiovascular risk.3,4 Several other studies have also documented non-fasting triglycerides to be a reliable predictor of cardiovascular risk.5 As a result, many national and international clinical guidelines, including those from Denmark, the United Kingdom, Europe and Canada, have recommended non-fasting lipid testing in the primary prevention setting.5
Hypothyroidism is a common endocrine disorder, with a population prevalence in the US of up to 9%.6 Patients with metabolic syndrome, diabetes or high cardiovascular risk who are undergoing periodic lipid profile testing may have underlying controlled or uncontrolled hypothyroidism. Uncontrolled hypothyroidism is known to have an impact on lipid profile in the fasting state.7 Elevated fasting levels of total cholesterol (TC), low-density lipoprotein cholesterol (LDL-C) and apolipoprotein-B (apo-B) have been documented in people with overt primary hypothyroidism (OPH), and to a lesser extent, in subclinical hypothyroidism (ScH).7 Although hepatic cholesterol synthesis is decreased in hypothyroidism, the paradoxical increased levels of fasting cholesterol parameters in hypothyroidism is believed to be due to decreased LDL-receptor (LDL-R) activity resulting from reduced sterol regulatory element binding protein-2, which is regulated by triiodothyronine.8,9 Data on the impact of this altered cholesterol metabolism in hypothyroidism on post-prandial lipid parameters are scant and have not been well studied.
Dietary habits are also known to impact post-prandial lipid status.1,10 Indians often consume meals predominantly comprised of carbohydrates.10 The impact of a high-carbohydrate meal on post-prandial lipids in people living with thyroid dysfunction is not known. Hence, the aim of this study was to evaluate the impact of two different severities of thyroid dysfunction (OPH and ScH) on post-prandial extended lipid parameters (TC, LDL-C, high-density lipoprotein cholesterol [HDL-C], triglycerides, apo-B, apolipoprotein-A1 [apo-A1] and lipoprotein-A [Lp-A]) at 1 hour, 2 hours and 4 hours after a standardised carbohydrate-rich mixed meal, consisting of food typically consumed in Indian culture.
Methods
Inclusion criteria for this study were age >18 years, a diagnosis with hypothyroidism but not receiving levothyroxine therapy, and current attendance at the outpatient department services of the department of endocrinology of the Dr Ram Manohar Lohia (RML) Hospital. Patients were excluded if they were pregnant; if they had diabetes, chronic kidney disease, liver disease, cardiac disease, heart failure, malignancy, epilepsy, tuberculosis, or an immunodeficiency; if they were taking medications that might impact thyroid hormones; or, if they had any co-existing conditions known to potentially impact lipid profile. Patients already taking lipid medications were also excluded. The study was approved by the institutional ethics committee. The study protocol was explained to the patients and only those who gave informed written consent were included. Forty age- and sex-matched healthy controls were recruited from nursing staff, reception staff and ward staff practicing at the hospital. Matched controls were apparently healthy, not on any medication, and had a normal thyroid profile on biochemical evaluation. Healthy matched controls gave informed written consent to participate in the study.
Participants attended the outpatient department at the hospital following a 12-hour fast. They underwent detailed clinical evaluation, along with measurement of anthropometric parameters. A blood sample was taking on arrival, as well as at 1 hour, 2 hours and 4 hours after a mixed meal. The blood sample was analysed for estimation of blood glucose, insulin, extended serum lipid profile (TC, LDL-C, HDL-C, triglycerides, Lp-A, apo-A1 and apo-B). Participants were then given a mixed breakfast of 576 kcal in the form of biscuits (Good Day® Butter biscuits, Britannia™, Bangalore, India; 81 g weight, 398 kcal) and a sweetened milk beverage (Kool Elaichi drink®, Amul, Anand, Gujarat, India; 200 mL, 178 kcal). Carbohydrates, proteins and fat constituted 79.1%, 7.7% and 13.2% of the meal, respectively.1
Insulin resistance in the basal state was calculated using the Homeostatic Model Assessment of Insulin Resistance (HOMA-IR) and basal β-cell activity was estimated using HOMA-β. Serum levels of Lp-A were measured using immunoturbidimetric assay (A00527, DIALAB® GmbH, Weiner Neudorf, Austria). The intra-assay and inter-assay precision were 2.5% and 4.9%, respectively. The reference range was 0–30 mg/dL. Serum levels of apo-A1 were measured by using immunoturbidimetric assay (Vitros® 5600, Ortho Clinical Diagnostics, New York, NY, USA). The reportable range of assay was 30–240 mg/dL. The intra-assay precision was 2.2%. The reference range was 101–215 mg/dL. Serum levels of apo-B were measured by using immunoturbidimetric assay (VITROS 5600). The reportable range of assay was 35–300 mg/dL. The intra-assay precision was 1.2%. The reference range was 51–132 mg/dL. The serum levels of high-sensitivity C-reactive protein were measured on a VITROS 5600 integrated system using the immunoturbidimetric method. The reportable range of the assay was 0.10–15.00 mg/L and the within lab precision was 1.2%. The reference range was taken as 1–3 mg/L. Thyroid profile (including TSH and free T4) and insulin levels were measured by chemiluminescence immunoassay (VITROS ECiQ Immunodiagnostic System, Ortho Clinical Diagnostics, New York, NY, USA). Biochemical parameters of blood glucose, kidney function test, liver function test and lipid profile (including total cholesterol, LDL-C, triglycerides and HDL-C) were also determined using the VITROS 5600 integrated system.
Statistical analysis
Normality of the distribution of variables was checked using the Kolmogrov–Smirnov test. Continuous variables were expressed as a mean ± standard deviation. A p value of <0.05 was considered to be statistically significant. Analysis of variance (ANOVA) with post hoc analyses and Kruskal–Wallis nonparametric ANOVA with Dunn’s post-correction were performed for normally and non-normally distributed variables, respectively. Chi‐squared tests were used for categorical variables. Pearson’s or Spearman’s correlation coefficient was calculated for normally and non-normally distributed variables, respectively. Version 16 of the Statistical Package for the Social Sciences (SPSS®, Chicago, IL, USA) was used for statistical analyses.
Results
Participants
Nine-hundred and twenty-two consecutive patients >18 years of age with hypothyroidism were initially screened in the endocrinology outpatient department services, from which, 194 patients with treatment-naïve hypothyroidism (161 patients with ScH and 33 patients with OPH) who fulfilled all inclusion criteria and did not fulfull any exclusion criteria gave informed written consent and underwent the mixed meal tolerance test. The reasons for exclusion of the 728 screened patients with hypothyroidism were: pregnancy (n=92), diabetes (n=181), chronic kidney disease (n=31), chronic liver disease (n=28), malignancies (n=20), associated severe co-morbid states (cardiovascular disease, heart failure) (n=57), patient already on levothyroxine therapy (n=283), and patient taking lipid medications (n=31). Five patients refused to consent for the study. The 40 age- and sex- matched healthy controls were
also evaluated.
Glycaemic and biochemical parameters and insulin resistance
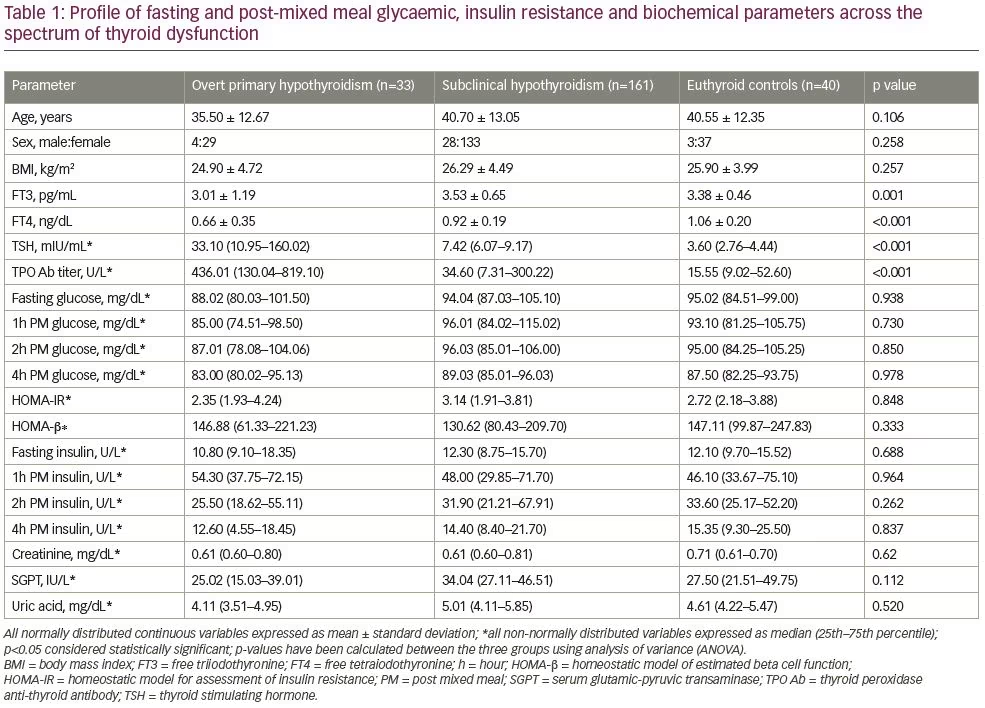
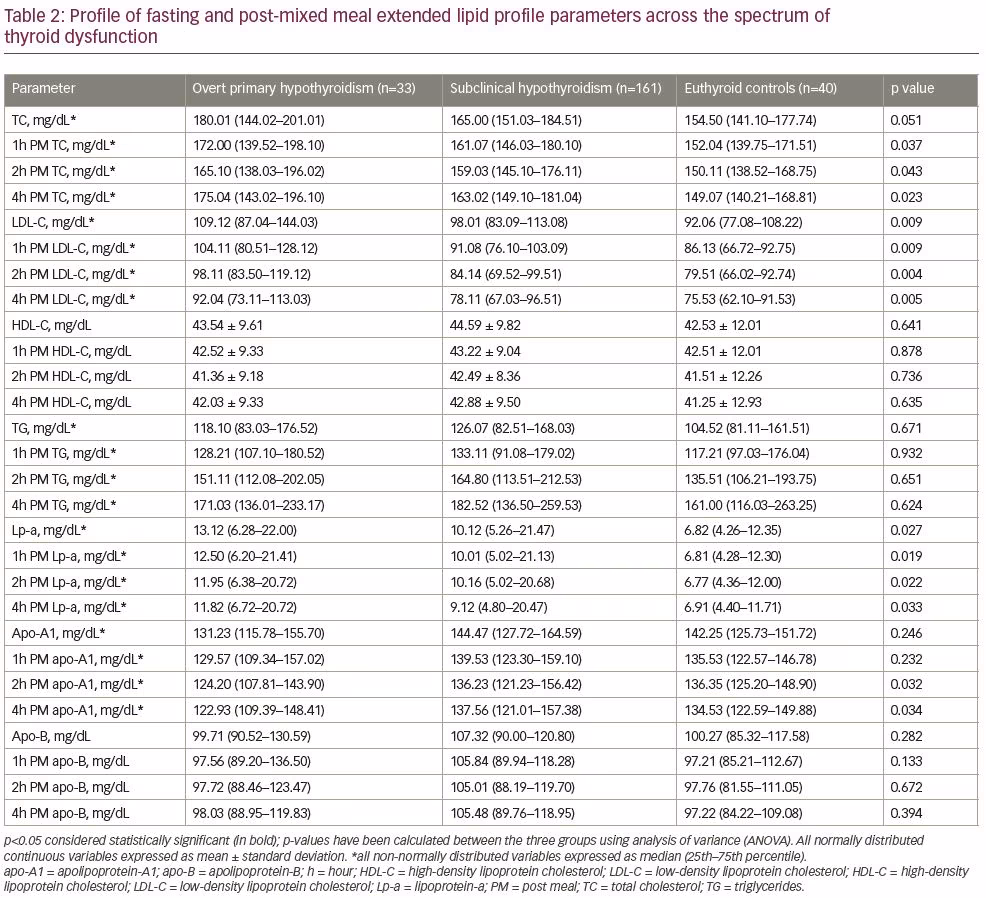
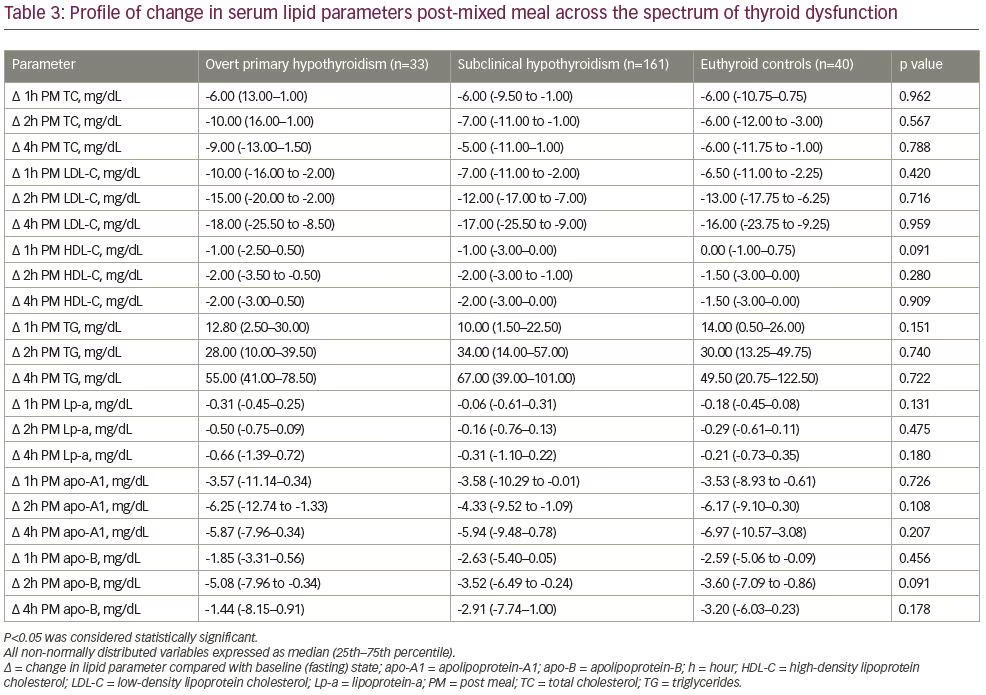
Anthropometric parameters (including measures of obesity), sex distribution, glycaemic parameters, measures of insulin resistance, and liver and renal parameters were comparable among patients with OPH, patients with ScH and matched controls (Table 1), demonstrated by post hoc pairwise analyses between each of the groups (Supplementary Tables 1–3). Post-hoc pairwise analyses revealed that thyroid peroxidase antibody titers were significantly higher in patients with OPH compared with those with ScH and healthy controls (Table 1 and Supplementary Tables 1–3). LDL-C was significantly higher in patients with OPH compared with ScH and control, both in the baseline state, as well as 1 hour, 2 hours and 4 hours after mixed meals (Table 2; post hoc analyses Supplementary Tables 4 and 5). TC was significantly higher in patients with OPH compared with controls, both in the baseline state as well as 1 hour, 2 hours, and 4 hours after mixed meals (Table 1; Supplementary Table 5). TC was higher in patients with OPH compared with ScH, both in the baseline state as well as 1 hour, 2 hours and 4 hours after mixed meals, but not statistically significant (Supplementary Table 4). There was a progressive decline in post-prandial levels of TC and LDL-C, which persisted up to 4 hours into the post-prandial state (Table 3). The decline was similar in all the groups (Table 3). HDL-C levels were similar in patients with OPH, ScH and controls, both in the fasting and post prandial state. There was a minimal decline in post-prandial HDL-C levels in all three groups, which was not statistically significant.
Serum triglycerides
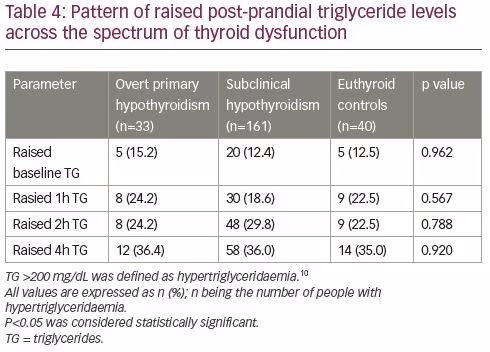
Serum triglycerides were similar in patients with OPH, ScH and controls, both in the fasting and post-prandial state (Table 2). There was a progressive increase in triglyceride levels in the post-prandial state from 1 hour to 4 hours in all three groups (Table 3). Hypertriglyceridaemia was defined as serum triglyceride >200 mg/dL.11 There was a similar increasing trend in the number of people with hypertriglyceridaemia at 1 hour, 2 hours and 4 hours after mixed meal in patients with OPH, ScH and controls (Table 4). Also, the quantum of increase in triglyceride levels (delta change) was similar in people with or without hypothyroidism (Table 3).
Lipoproteins
Lp-A was significantly elevated in patients with hypothyroidism compared with controls, with the highest levels seen in patients with OPH, followed by ScH, and was lowest in controls (Table 2). Post-hoc analysis revealed that Lp-A was significantly higher when patients with OPH were compared with controls (Supplementary Table 5), and when ScH was compared with controls (Supplementary Table 6), both in the baseline state as well as 1 hour, 2 hours and 4 hours after mixed meals. Lp-A was not significantly different when patients with OPH was compared to patients with ScH, both in the baseline state, as well as 1 hour, 2 hours and 4 hours after mixed meals (Supplementary Table 4). Similar trends of highest levels of Lp-A in patients with OPH were seen 1 hour, 2 hours and at 4 hours after the mixed meal. There was a progressive decline in Lp-A in the post-prandial state, a trend which continued up to 4 hours after ingesting the meal (Table 2). The quantum of decline was similar in people with or without hypothyroidism (Table 3).
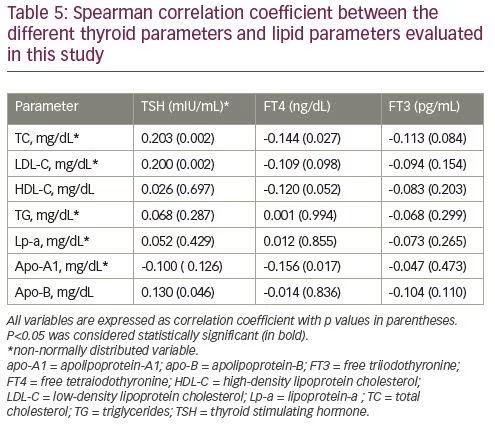
Apo-A1 levels were comparable in all the three groups (OPH, ScH and controls) when measured in the fasting state and in the 1-hour post-prandial state (Table 2). However, at 2 hours and 4 hours after mixed meal ingestion, serum apo-A1 levels were significantly lower in patients with OPH (Table 2). Serum apo-B levels were comparable in the fasting and post-prandial state in patients with OPH, patients with ScH and healthy controls. Thyroid-stimulating hormone had a statistically significant positive correlation with TC, LDL-C and apo-B (Table 5).
Free T4 had a statistically significant negative correlation with TC and apo-A1 (Table 5).
Discussion
Our study showed that patients with OPH and ScH had higher serum TC, LDL-C and Lp-A compared with healthy controls at baseline, which persisted at 1 hour, 2 hours and 4 hours into the post-prandial period. A decrease in levels of serum LDL-C, HDL-C, Lp-A, apo-A1 and apo-B levels was noted in the post-prandial state, both in people with OPH and ScH, as well as in the healthy controls, compared with the fasting state assessment. The greatest decrease was observed at 2 hours post-meal ingestion for TC, apo-A1 and apo-B; and at the 4-hour post-prandial timepoint for LDL-C and Lp-A compared with the fasting state assessment. Hypothyroidism is associated with an increase in the above-mentioned lipid parameters (TC, LDL-C and Lp-A) in the post-prandial state compared with fasting state, which was similar between the fasting and the post-prandial state. The severity of hypothyroidism had no impact on post-prandial change in the different cholesterol and lipoprotein parameters. This suggests that the interpretation of cholesterol and lipoprotein levels taken in a non-fasting state would be as reliable in a patient with hypothyroidism as in a patient without hypothyroidism. Hypothyroidism has no impact on post-prandial cholesterol and lipoprotein interpretation. We have previously documented a similar drop in triglycerides, LDL-C and HDL-C to those noted in this study, both in people with diabetes and in healthy individuals.1
The cause for the increase in triglycerides, LDL-C and Lp-A in hypothyroidism is multifactorial and includes decreased LDL-R expression, increased hepatic expression of hydroxymethylglutaryl coenzyme A and increased cholesterol absorption from the gut.12 Both OPH and ScH are associated with varying degrees of hyperprolactinaemia, the correction of which is associated with reduction in cholesterol levels, insulin resistance and improvement in glycaemia.13–16 This underpins the use of dopamine agonist therapy in metabolic syndrome/type 2 diabetes.15,16
Studies have consistently shown that restoration of euthyroidism with levothyroxine supplementation is associated with reduction in levels of triglycerides, LDL-C and apo-B levels.17 Levothyroxine therapy has no impact on apo-A1 levels.17 Thus, irrespective of whether the lipid profile is tested in the fasting or non-fasting state, hypercholesterolemia medication should ideally only be commenced if hypercholesterolemia persists after the correction of hypothyroidism.
Only triglycerides were elevated in the post-prandial state compared with the fasting state in all the three study groups with maximum levels seen at 4 hours post meal, and again the quantum of change in the post-prandial levels were similar in study participants with or without hypothyroidism. It must be highlighted that the degree of change in different lipid parameters (including triglycerides) evaluated in this study in the post-prandial state compared with the fasting state was similar in people with hypothyroidism (OPH and ScH) compared with healthy controls. Hence hypothyroidism had no impact on the extended lipid profile assessment in the post-prandial state. As is the case in healthy individuals, documented hypertriglyceridaemia in the post-prandial state in people living with hypothyroidism needs to be reconfirmed in the fasting state if treatment initiation is being considered. When detected in the post-prandial state, treatment for hypercholesterolaemia can be started directly, without any need for re-confirmation in the fasting state.
In a small study involving 25 patients with OPH, 27 patients with ScH and 23 controls, no significant differences in the fasting levels of TC, LDL-C, very low-density lipoprotein cholesterol [VLDL-c], triglycerides, insulin resistance (HOMA-IR) and estimated beta cell function (HOMA-β), were noted among the three groups; findings which are comparable to the observations noted in this study.18 However, the authors documented that the mean triglycerides and VLDL-C at 8-hours post-prandial was significantly higher in patients with OPH and ScH compared with controls.18 Post-prandial follow-up beyond 4 hours was not carried out in our study.
Increased insulin resistance is associated with increased hepatic triglyceride and increased VLDL-C production, coupled with delayed clearance of triglyceride-rich lipoprotein particles from the circulation, which explains the greater surge in post-prandial triglyceride levels in people with diabetes and insulin resistance, when compared with the fasting triglyceride levels.19,20 We did document a similar increase in triglyceride levels in the post-prandial state both in people with and without hypothyroidism. A similar comparable measure of insulin resistance (measured using HOMA-IR) in people with or without hypothyroidism may explain the lack of change in triglyceride levels among the groups in our study. This reaffirms the notion that it is in fact the insulin resistance and not hypothyroidism that impacts post-prandial triglyceride levels.
We have previously documented that non-fasting blood samples can be safely used for assessing lipid parameters in Indians with diabetes and normoglycaemia consuming a typical carbohydrate-rich Indian diet.1 Similarly, a study from Korea showed that a non-fasting lipid sample can be reliably used for assessing lipid parameters in patients with type 2 diabetes on statins consuming a typical Korean diet.21 A direct estimation of LDL should be completed for determining LDL-C levels, when a non-fasting sample is used for analysis, as the LDL-C values calculated using the Friedewald equation would not hold true in the setting of post-prandial hypertriglyceridaemia.22 McGowan et al. suggested that reduced cholesteryl-ester-transfer-protein activity may have a subtle impact on HDL-2 and HDL-3 subtypes of HDL cholesterol in patients with OPH.23
In a study from Greece, 6-month levothyroxine supplementation in patients with ScH did not result in any significant change in serum levels of TC, LDL-C, HDL-C, triglycerides, Apo-B, glucose, insulin, HOMA-IR, high sensitivity C-reactive protein, antithrombin-III, protein-C, protein-S, fibrinogen or homocysteine after restoration of euthyroidism.24 Very mild ScH may explain the lack of changes in serum levels of TC, LDL-C and apo-B in the previous study, whose levels are typically increased in OPH and ScH and usually normalise following restoration of euthyroidism, unless there are other associated factors contributing to dyslipidaemia, such as significant insulin resistance and metabolic syndrome.25 Levothyroxine therapy has also been shown to reduce serum levels of apo-B-48 in both OPH and ScH following restoration of euthyroidism.25 Apo-B-48 is a constituent of chylomicrons and chylomicron remnants and is believed to contribute to atherosclerosis.26 Apo-B-48 levels were, however, not evaluated in our study.
Limitations of this study include the fact that prolactin levels were not evaluated. Additionally, this study did not go into the mechanistic reason for the pattern of dyslipidaemia seen in hypothyroidism. Lack of availability of follow-up data evaluating the impact of correction of hypothyroidism on the different lipid parameters is also a limitation.
To summarise, the results of this study suggest that the degree of hypothyroidism (OPH or ScH) has no impact on the post-prandial lipid parameters for up to 4 hours into the post-prandial period. The lipid profile can be reliably estimated in the non-fasting state in people living with subclinical or OHP, irrespective of the severity of hypothyroidism.