touchENDOCRINOLOGY touchENDOCRINOLOGY
Obesity
Read Time: 9 mins

Salivary Leptin Level in Young Adult Males and its Association with Anthropometric Measurements, Fat Distribution and Muscle Mass

Copy Link
Published Online: Jul 20th 2018 European Endocrinology, 2018;14(2):94–8 DOI: https://doi.org/10.17925/EE.2018.14.2.94
Authors: Mona Mohamed Ibrahim Abdalla, Soon Siew Choo
Quick Links:
Abstract
Article
Article Information
Abstract:
Overview

Aims: 1) To assess salivary leptin levels in normal–underweight versus overweight and obese healthy adult males aged 18–25 years old. 2) The relative contribution of anthropometric measurements, fat percentage, fat distribution (visceral versus subcutaneous) and total as well as regional muscle mass in arms, trunk and legs respectively in predicting salivary leptin levels. Methods: A total of 92 adult males were classified into two groups based on their body mass index (BMI): normal–underweight, BMI ≤24.9 kg/m2 (n=51); overweight–obese, BMI ≥25 kg/m2 (n=41). Anthropometric measurements such as BMI, waist circumference (WC), hip circumference (HC) and waist–hip ratio (WHR) were measured through standardised methods. Fat percentage, visceral fat level, subcutaneous fat and muscle mass (total and regional) were measured using Karada scan bioelectrical impedance method. Fasting saliva samples were collected and used for assessing salivary leptin concentrations using enzyme-linked immunosorbent assay. Results: Statistical analysis of the data showed a significant difference between the two groups in all of the parameters measured except height and salivary leptin levels. Multiple regression analysis showed that HC, WC and WHR were good predictors for salivary leptin levels in normal–underweight group. However, in the overweight–obese group, height was the most important independent variable that could predict salivary leptin levels as a dependent variable. Conclusions: Predictors for salivary leptin levels in adult healthy males are different in normal–underweight subjects from overweight–obese subjects. The most important predictor for salivary leptin levels is HC in normal weight subjects, while it is height in overweight and obese healthy adult males.

Keywords

Visceral fat, subcutaneous fat, obesity, muscle
mass, salivary leptin, body mass index

Article:

The prevalence of overweight and obese people is increasing worldwide. This is accompanied with an increase in many diseases such as non-insulin dependent diabetes mellitus, hypertension, and even certain cancers.1,2 Obesity is defined as an excessive accumulation of body fat that is caused by the imbalance between energy intake and energy expenditure.2 Adults are one of the subpopulations in which obesity is more prevalent and they are more liable to develop cardiovascular complications.3

Adipose tissue is an active endocrine tissue that releases many adipokines. The alterations in the secretory profile of this adipose tissue were found to be the reason for the disturbed fat metabolism and obesity-associated complications.4 Furthermore, it was shown that the site of fat accumulation in the body, whether visceral (around the visceral organs) or subcutaneous, has a great influence on the development of obesity-related complications.5 Studies showed a strong correlation between visceral fat (VF) accumulation and the occurrence of obesity complications,6,7 which has been proven by Sarr et al.,5 who reported strong association between VF accumulation and an increased release of pro-inflammatory adipokines. However, beneficial adipokines such as leptin and adiponectin, have shown a higher presence in subcutaneous fat (SCF).8

Leptin is one of the most important adipokines secreted from the adipose tissue. It has complex and multidirectional actions that mainly include suppression of appetite and regulation of body weight.9 Thus, it has been proven in mice, and also humans, that a lack of leptin is associated with marked increase in food intake and development of severe obesity and diabetes mellitus,10–12 an effect that was reversed by administration of leptin.13 Obesity can also be due to leptin resistance, a condition whereby leptin is available but does not reduce food intake and fat accumulation.14 This leptin resistance was found to be reversed with fat loss.15

In addition to adipose tissue, skeletal muscles and bones have been shown to be important sources of circulating leptin16,17 and also targets for leptin actions as leptin receptors were found to be expressed in abundance in both muscle and bone cells.18 The high concentration of leptin found in skeletal muscle cells is not derived from the muscle fat but from the muscle cells themselves.19

Several studies showed an association between the serum level of leptin and body mass index (BMI),20–22 as well as fat distribution in obese individuals.22,23 However, it has been shown that serum leptin level varies with each BMI level.12

Saliva has been proven to be a reliable alternative diagnostic tool that can be used to measure blood biomarkers in healthy as well as diabetic individuals because of the strong correlation between the protein levels in serum and saliva.24,25 The non-invasive nature of saliva sampling provides a potential to be used as a diagnostic and screening tool in population-based screening studies such as screening for obesity-associated inflammatory markers. Although saliva is a good alternative for serum to measure many biomarkers, there are limited studies which investigate the association between salivary leptin level with BMI, fat distribution and muscle mass.26,27

The present study aimed to assess the salivary leptin concentrations in normal weight versus overweight and obese healthy adult males aged between 18–25 years old and the relative contribution of BMI, waist circumference (WC), hip circumference (HC), waist–hip ratio (WHR), SCF, VF level, whole body fat percentage (WF), whole body muscle mass, muscle mass of the arms, trunk and legs respectively in predicting the salivary leptin levels. The study was limited to only one race and one gender to reduce the effect of confounding factors on salivary leptin levels. A study conducted in Malaysia found an increase in the prevalence of obesity among medical students, especially males.3 To the best of our knowledge, this is the first study to investigate the association between the salivary leptin level with BMI and fat distribution in adult Malay males.

Materials and methods

Ethical approval

The study design and consent forms were approved by the Research Management Committee of MAHSA University, Malaysia. All procedures were followed in accordance with the responsible committee on human experimentation and with the Helsinki Declaration of 1975 and subsequent revisions, and informed consent was received from the participants involved in this study.

Subjects

All participants were fully informed about the objectives of the study before completing their written consent forms. Subjects with a history of diabetes or cardiac diseases were excluded from the study. Other exclusion criteria included hormonal alteration, gain or loss of body weight >5 kg in the last 3 months, and use of drugs which could modulate body composition.

Anthropometric measurements

Height of subjects was measured to the nearest 0.1 cm using stadiometer. Body weight, BMI, WF, resting metabolism (RM), VF level, whole body SCF and body age measurements were measured using Omron Karada Scan HBF-362 Bioelectrical Impedance (Omron, Kyoto Prefecture, Japan); a method of measuring fats which has been proven to correlate well with body fat analysed by dual-energy X-ray absorptiometry (DEXA)28,29 and even by computed tomography.30 Body age is calculated based on body mass, body fat and resting metabolism. Each subject stood barefooted and upright in the middle of the sensor platform, holding the fat analyser with his extended arms. WC and HC of each subject were measured to the nearest 0.1 cm using measuring tape while standing. WHR was calculated whereby WC was measured around the waist at midpoint between the lower costal border (tenth rib) and the iliac crest at the end of normal expiration, while HC was measured at the maximum circumference around the buttocks. Based on the World Health Organisation (WHO) classification of BMI, participants were categorised into two groups according to their BMI; normal-underweight control group (BMI ≤24.9 kg/m2) and overweight–obese group (BMI ≥25 kg/m2).31

Saliva collection

An average of 5 ml of fasting non-stimulated saliva was collected by using the drooling technique from each subject. All subjects were advised to rinse their mouths with water thoroughly before saliva collection. Proper instructions were given to ensure collection of suitable and uncontaminated saliva samples. Saliva samples were collected into test tubes between 9:00 a.m. and 12:00 noon, and kept in ice before being centrifuged for 15 minutes at 3000 rpm at 4°C. The supernatant was then divided into aliquots of 1 ml in Eppendorf tubes and stored at -80°C until analysis.

Measurement of salivary leptin concentration

The frozen salivary samples were brought up to room temperature and salivary leptin was measured by enzyme-linked immunosorbent assay (ELISA) utilising the commercial ELISA kit for human leptin (SEA084Hu, Cloud-Clone Corp., Houston, TX, USA). The assay was conducted according to the manufacturer’s instructions.32 Each salivary sample was analysed in duplicates.

Statistical analysis

Data were analysed using IBM SPSS version 22.0 (SPSS Institute, Chicago, IL, USA). Independent sample T-test was used to compare between the two groups in all the parameters measured. Multiple regression analysis was used to analyse the association of salivary leptin concentration as a dependent variable with age, height, weight, BMI, WC, HC, WHR, WF, SCF, VF, whole body skeletal muscle mass, regional muscle mass in arms, legs and trunk, as independent variables in both groups. Levels of significance used in this study are as follows: p<0.05 is considered significant with a confidence interval (CI) 95%, p<0.01 significant with CI 99%, p<0.1 is considered significant with CI 90%.

Results

This was a cross-sectional study of 92 healthy adult Malay males, aged between 18–25 years old. Salivary samples from all participants were analysed, of which 55.4 % (n=51) were of normal–underweight and 44.5 % (n=41) were overweight–obese (Table 1). All of the measured variables were found to be significantly different between the two groups, except salivary leptin levels and height, which were found to be similar (see Table 1).

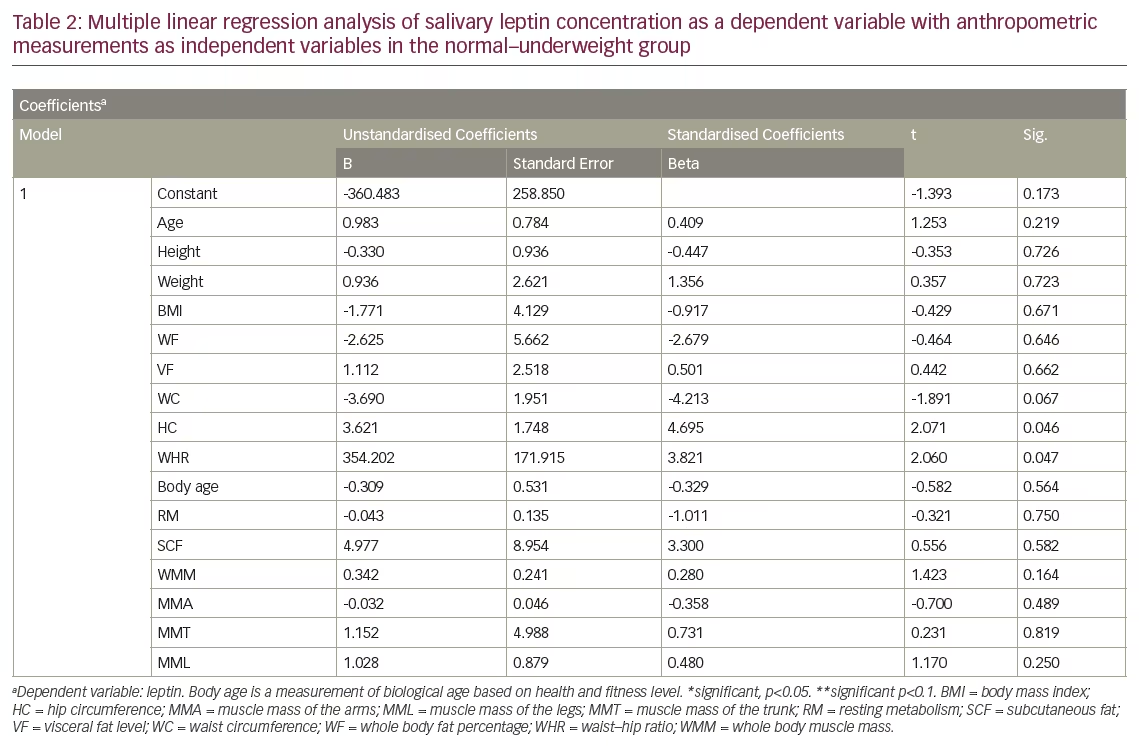
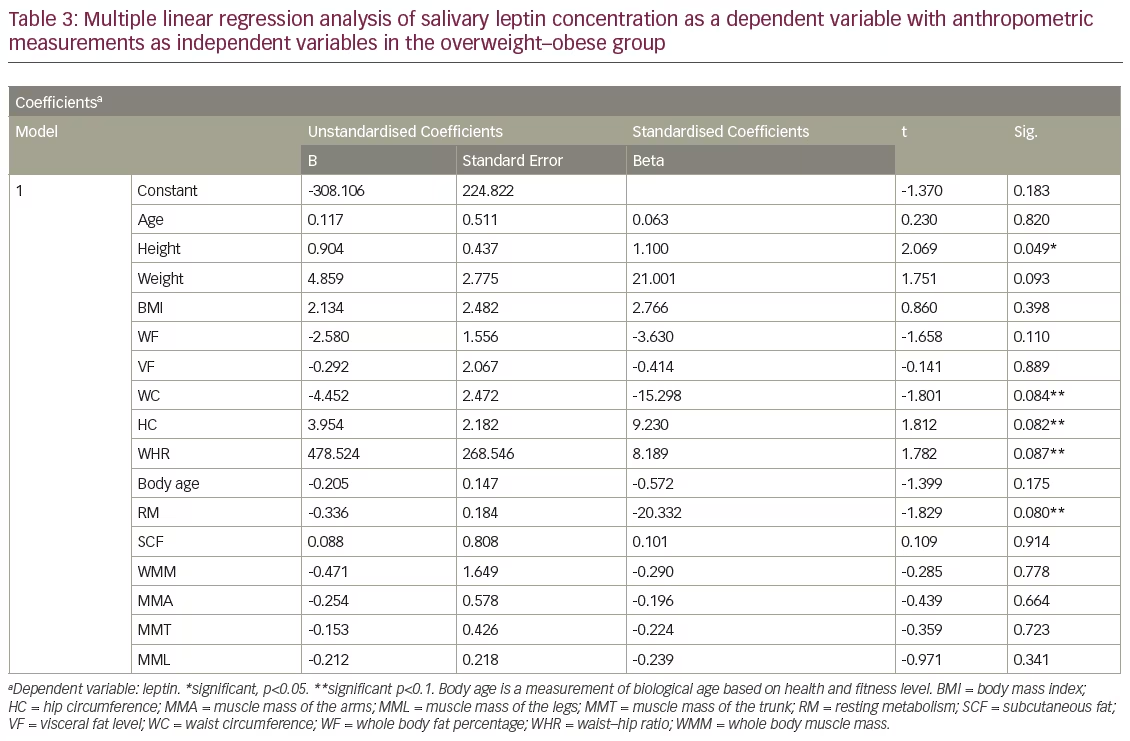
In the normal–underweight group, a multiple regression analysis revealed a significant positive correlation between salivary leptin levels with HC, WC and WHR, with HC being the most important predictor for salivary leptin levels (see Table 2). However, the analysis revealed an absence of correlation between salivary leptin levels with age, weight, BMI, WF, VF, SCF, whole body skeletal muscle mass, regional muscle mass in arms, legs and trunk (see Table 2) in the same group. In overweight–obese group, the regression analysis revealed a significant correlation between salivary leptin levels with height at p<0.05, WC, HC, WHR and RM with p<0.1. The results also showed lack of correlation of salivary leptin levels with any of the other anthropometric measurements (see Table 3).

Discussion

The strong correlation that has been reported between the protein levels in saliva and plasma,24 has made saliva an attractive diagnostic tool that can be used as an alternative to blood to measure several biomarkers. A previous study showed that salivary leptin levels were almost the same as they are in plasma,33 and another study reported a strong correlation between salivary and plasma leptin levels in adults.27 These findings support that the salivary leptin levels that are reported in our study are equivalent with leptin plasma levels. This is the first study to investigate the association of salivary leptin concentrations with BMI, fat distribution in subcutaneous versus visceral, total skeletal muscle mass as well as regional muscle mass in arms, trunk and legs, body age and resting metabolism in healthy young adult Malay males who are normal–underweight versus overweight–obese. This will help to investigate the most important anthropometric measures that can be used to predict the level of salivary leptin in these groups of people. The current study was limited to only one ethnic group to reduce the confounding factors that may affect leptin concentrations.34

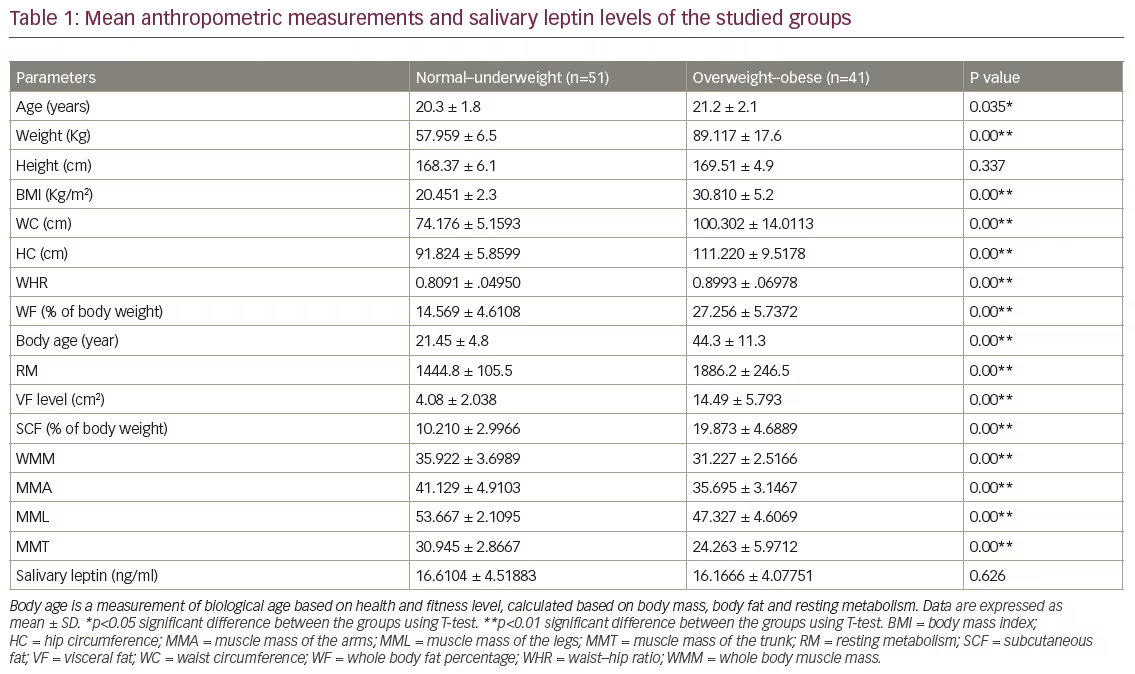
Although, the present study confirmed the presence of a highly significant difference between normal-underweight and overweight-obese adult males in body weight, BMI, WF, VF, SCF, total and regional skeletal muscle masses, body age and resting metabolism, there was no difference between the two groups in their height nor their salivary leptin levels. This may reflect the importance of height in determining the salivary leptin levels.

The lack of association between leptin levels and BMI that is found in our study is in agreement with the finding of a study done in Burnei secondary school children who were mostly Malays.26 Contrary to that, studies conducted among Omanis and Pakistanis have reported the presence of positive association between serum leptin levels and BMI.20,35 These conflicting results could be due to the different ethnic and age groups used. Further studies are needed in this regard for more understanding.

Our study also revealed lack of correlation between salivary leptin levels with WF as well as fat distribution; visceral versus subcutaneous. Controversial results from similar studies done among different population groups have been reported. A study done in older Caucasian and African-America subjects of both genders in the United States revealed that leptin concentrations were dependent on WF in Caucasian women but not in African-American women or in men.21,36 Another study reported that serum leptin levels were correlated with the WF but not abdominal fat.37 Further studies are required to find out the effect of ethnicity, age and gender (hormonal difference) on the correlation between leptin levels and adiposity measures.

Our results confirm the presence of a difference in the predictors for salivary leptin levels in the normal–underweight group as compared with the overweight–obese group. HC seemed to be the most important predictor for salivary leptin levels in the normal–underweight group. This is in agreement with Ho et al. who reported HC as a significant determinant for plasma leptin in an Asian cohort.38 The inverse correlation between HC with blood glucose and lipids as well as blood pressure that were reported by previous studies39–42 could be explained by the positive predictive effect of HC on salivary leptin levels found in the present study; as HC increases, leptin levels increases.

WC and WHR appear to be good predictors for salivary leptin levels in both of the groups in our study. This is in agreement with findings in similar studies involving different populations.43–45 This is also partially in agreement with Ayina et al., who reported that BMI and WC were significantly associated with leptin in a Sub-Saharan African population.46

The findings of the present study showed that height was the strongest predictor for salivary leptin levels in overweight–obese subjects. As height increases by one unit, salivary leptin increases by 0.9 units. This may be explained by the fact that bone is an important source of leptin.17 However, a study conducted by Wells and Cole reported that height was independently negatively associated with leptin.47 These contradictory results may be explained by the different age groups used.

The direct correlation observed between leptin and height may be also explained by the central and peripheral effects of leptin on bone mass. In addition to the central effect of leptin in prompting the increase of bone mass that has been reported in leptin-deficient ob/ob mice following central infusion of leptin,48 leptin has a direct effect on the osteoblasts and bone-derived mesenchymal cells.49 Leptin receptors were also found to be abundant in the periosteium.17 In addition, the stimulating effect of leptin on bone can be mediated by insulin-like growth factor-1, which is a potent osteogenic factor.17

In conclusion, our study revealed lack of association between salivary leptin concentrations with BMI, WF and fat distribution in healthy adult Malay males at MAHSA University. HC is the most important predictor of salivary leptin levels in normal–underweight adult healthy males, while height is the most important predictor for salivary leptin levels in overweight–obese males of the same age group. WC and WHR are good predictors for salivary leptin levels in healthy adult males in the normal–underweight as well as the overweight–obese groups. Further studies are required to investigate the plasma and salivary leptin levels in correlation with body composition, in both males and females of different ethnic groups.

Article Information:
Disclosure

Mona Mohamed Ibrahim Abdalla and Soon
Siew Choo have nothing to disclose in relation to this article.

Review Process

Double-blind peer review.

Authorship

All named authors meet the criteria of
the International Committee of Medical Journal Editors
for authorship for this manuscript, take responsibility
for the integrity of the work as a whole and have given
final approval for the version to be published.

Correspondence

Mona Mohamed Ibrahim Abdalla,
Level 7, Main Building, Bandar Saujana Putra, 42610
Jenjarom, Selangor, Malaysia.
E: monaalbetar@yahoo.com; dr.mona@mahsa.edu.my

Support

This article was funded by a grant
from MAHSA University, Malaysia.

Access

This article is published
under the Creative Commons Attribution Noncommercial
License, which permits any non-commercial
use, distribution, adaptation and reproduction
provided the original author(s) and source are
given appropriate credit. © The Authors 2018.

Acknowledgements

We would like to thank
MAHSA University Research Management Centre
for approving and funding of the present study,
MAHSA students for their participation and Faculty
of Medicine for providing the required facilities.
Compliance with Ethics: The study design and
consent forms were approved by the Research
Management Committee of MAHSA University, Malaysia.
All procedures were followed in accordance with the
responsible committee on human experimentation
and with the Helsinki Declaration of 1975 and
subsequent revisions, and informed consent was
received from the participants involved in this study.

Received

2018-04-16T00:00:00

References

  1. Gallagher EJ, LeRoith D. Obesity and diabetes: the increased risk of cancer and cancer-related mortality. Physiol Rev. 2015;95:727–48.
  2. Meldrum DR, Morris MA, Gambone JC. Obesity pandemic: causes, consequences, and solutions-but do we have the will? Fertil Steril. 2017;107:833–9.
  3. Gopalakrishnan S, Ganeshkumar P, Prakash MV, et al. Prevalence of overweight/obesity among the medical students, Malaysia. Med J Malaysia. 2012;67:442–4.
  4. Reilly SM, Saltiel AR. Adapting to obesity with adipose tissue inflammation. Nat Rev Endocrinol. 2017;13:633–43.
  5. Sarr O, Strohm RJ, MacDonald TL, et al. Subcutaneous and visceral adipose tissue secretions from extremely obese men and women both acutely suppress muscle insulin signalling. Int J Mol Sci. 2017;18:E959.
  6. McLaughlin T, Lamendola C, Liu A, Abbasi F. Preferential fat deposition in subcutaneous versus visceral depots is associated with insulin sensitivity. J Clin Endocrinol Metabol. 2011;96:E1756–60.
  7. Neeland IJ, Ayers CR, Rohatgi AK, et al. Associations of visceral and abdominal subcutaneous adipose tissue with markers of cardiac and metabolic risk in obese adults. Obesity (Silver Spring). 2013;21:E439–47.
  8. Van Harmelen V, Reynisdottir S, Eriksson P, et al. Leptin secretion from subcutaneous and visceral adipose tissue in women. Diabetes. 1988;47:913–7.
  9. Klok MD, Jakobsdottir S, Drent ML. The role of leptin and ghrelin in the regulation of food intake and body weight in humans: a review. Obes Rev. 2007;8:21–34.
  10. Farooqi S, Matarese G, Lord GM, et al. Beneficial effects of leptin on obesity, T cell hyporesponsiveness, and neuroendocrine/metabolic dysfunction of human congenital leptin deficiency. J Clin Invest. 2002;110:1093–103.
  11. De Luis DA, Perez Castrillon JL, Duenas A, Leptin and obesity. Minerva Medica. 2009;100:229–36.
  12. Facey A, Dilworth L, Irving R. A review of the leptin hormone and the association with obesity and diabetes mellitus. J Diabetes Metab. 2017;8:727.
  13. Halaas JL, Gajiwala KS, Maffei M, et al. Weight-reducing effects of the plasma protein encoded by the obese gene. Science. 1995;269:543–6.
  14. Ahima RS, Prabakaran D, Mantzoros C, et al. Role of leptin in the neuroendocrine response to fasting. Nature. 1996;382:250–2.
  15. Enriori PJ, Evans AE, Sinnayah P, et al. Diet-induced obesity causes severe but reversible leptin resistance in arcuate melanocortin neurons. Cell Metabolism. 2007;5:181–94.
  16. Wolsk E, Mygind H, Grondahl TS, et al. Human skeletal muscle releases leptin in vivo. Cytokine. 2012;60:667–73.
  17. Hamrick MW. Role of the cytokine-like hormone leptin in muscle-bone crosstalk with aging. J Bone Metab. 2017;24:1–8.
  18. Guerra B, Santana A, Fuentes T, et al. Leptin receptors in human skeletal muscle. J Appl Physiol (1985). 2007;102:1786–92.
  19. Hamrick MW, McGee-Lawrence ME, Frechette DM. Fatty infiltration of skeletal muscle: mechanisms and comparisons with bone marrow adiposity. Front Endocrinol (Lausanne). 2016;7:69.
  20. Kazmi A, Sattar A, Hashim R, et al. Serum leptin values in the healthy obese and non-obese subjects of Rawalpindi. J Pak Med Assoc. 2013;63:245–8.
  21. Ruhl CE, Harris TB, Ding J, et al. Body mass index and serum leptin concentration independently estimate percentage body fat in older adults. Am J Clin Nutr. 2007;85:1121–6.
  22. Minocci A, Savia G, Lucantoni R, et al. Leptin plasma concentrations are dependent on body fat distribution in obese patients. Int J Obes Relat Metab Disord. 2000;24:1139–44.
  23. Lubkowska A, Radecka A, Bryczkowska I, et al. Serum adiponectin and leptin concentrations in relation to body fat distribution, hematological indices and lipid profile in humans. Into J Environ Res Public Health. 2015;12:11528–48.
  24. Desai GS, Mathews ST. Saliva as a non-invasive diagnostic tool for inflammation and insulin-resistance. World J Diabetes. 2014;5:730–8.
  25. Schmidt EMS, Escribano D, Martinez-Subiela S, et al. Development and validation of an assay for measurement of leptin in pig saliva. BMC Vet Res. 2016;12:242.
  26. Idris A, Khamis AG, Ghazali NB, et al. Salivary leptin concentrations in Bruneian secondary school children. Asian Pac J Trop Biomed. 2016;6:335–7.
  27. Thanakun S, Watanabe H, Thaweboon S, Izumi Y. Comparison of salivary and plasma adiponectin and leptin in patients with metabolic syndrome. Diabetol Metab Syndr. 2014;6:19.
  28. Sluyter JD, Schaaf D, Scragg RK, Plank LD. Prediction of fatness by standing 8-electrode bioimpedance: a multiethnic adolescent population. Obesity (Silver Spring). 2010;18:183–189.
  29. Fakhrawi DH, Beeson L, Libanati C, et al. Comparison of body composition by bioelectrical impedance and dual-energy x-ray absorptiometry in overweight/obese postmenopausal women. J Clin Densitom. 2009;12:238–44.
  30. Lee DH, Park KS, Ahn S, et al. Comparison of abdominal visceral adipose tissue area measured by computed tomography with that estimated by bioelectrical impedance analysis method in korean subjects. Nutrients. 2015;7:10513–24.
  31. WHO Expert Consultation. Appropriate body mass index for Asian populations and its implication for policy and intervention strategies. Lancet. 2004;363:157–63.
  32. Cloud-Clone Corp. Enzyme-linked Immunosorbent Assay Kit For Leptin (LEP) Organism Species: Homo sapiens (Human) Instruction manual. 2013.
  33. Aydin S, Halifeoglu I, Ozercan IH, et al. A comparison of leptin and ghrelin levels in plasma and saliva of young healthy subjects. Peptides. 2005;26:647–52.
  34. Etemad A, Ramachandran V, Pishva SR, et al. Analysis of Gln223Agr polymorphism of leptin receptor gene in type II diabetic mellitus subjects among Malaysians. Int J Mol Sci. 2013;14:19230–44.
  35. Al Maskari MY, Alnaqdy AA. Correlation between serum leptin levels, body mass index and obesity in Omanis. Sultan Qaboos Univ Med J. 2006;6:27–31.
  36. Cohen SS, Fowke JH, Cai Q, et al. Differences in the association between serum leptin levels and body mass index in black and white women: a report from the Southern Community Cohort Study. Ann Nutr Metab. 2012;60:90–7.
  37. Shimizu H, Shimomura Y, Hayashi R, et al. Serum leptin concentration is associated with total body fat mass, but not abdominal fat distribution. Int J Obes Relat Metab Disord. 1997;21:536–41.
  38. Ho SC, Tai ES, Eng PH, et al. A study in the relationships between leptin, insulin, and body fat in Asian subjects. Int J Obes Relat Metab Disord. 1999;23:246–52.
  39. Cameron AJ, Magliano DJ, Shaw JE, et al. The influence of hip circumference on the relationship between abdominal obesity and mortality. Int J Epidemiol. 2012;41:484–94.
  40. Snijder MB, Zimmet PZ, Visser M, et al. Independent and opposite associations of waist and hip circumferences with diabetes, hypertension and dyslipidemia: the AusDiab Study. Int J Obes Relat Metab Disord. 2004;28:402–9.
  41. Lissner L, Bjorkelund C, Heitmann BL, et al. Larger hip circumference independently predicts health and longevity in a Swedish female cohort. Obes Res. 2001;9:644–46.
  42. Parker ED, Pereira MA, Stevens J, Folsom AR. Association of hip circumference with incident diabetes and coronary heart disease: the Atherosclerosis Risk in Communities study. Am J Epidemiol. 2009;169:837–47.
  43. Taleb MH, Younis SJ, Zabout B, et al. Relationship of serum leptin, BMI, waist circumference and cholesterol level among teenagers in the Gaza strip. Pharmacology & Pharmacy. 2014;5:789–95.
  44. Monti V, Carlson JJ, Hunt SC, Adams TD. Relationship of ghrelin and leptin hormones with body mass index and waist circumference in a random sample of adults. J Am Diet Assoc. 2006;106:822–8.
  45. Stepien M, Rosniak-Bak K, Paradowski M, et al. Waist circumference, ghrelin and selected adipose tissue-derived adipokines as predictors of insulin resistance in obese patients: Preliminary results. Med Sci Monit. 2011;17:PR13–8.
  46. Ayina CN, Noubiap JJ, Etoundi Ngoa LS, et al. Association of serum leptin and adiponectin with anthropomorphic indices of obesity, blood lipids and insulin resistance in a Sub-Saharan African population. Lipids Health Dis. 2016;15:96.
  47. Wells JCK, Cole TJ. Height, adiposity and hormonal cardiovascular risk markers in childhood: how to partition the associations? International Journal of Obesity. 2014;38:930–5.
  48. Bartell SM, Rayalam S, Ambati S, et al. Central (ICV) leptin injection increases bone formation, bone mineral density, muscle mass, serum IGF-1, and the expression of osteogenic genes in leptin-deficient ob/ob mice. J Bone Miner Res. 2011,26;1710–20.
  49. Zhou BO, Yue R, Murphy MM, et al. Leptin Receptor-expressing mesenchymal stromal cells represents the main source of bone formed by adult bone marrow. Cell Stem Cell. 2014;15:154–68.

Further Resources

Share this Article
Related Content In Obesity
  • Copied to clipboard!
    accredited arrow-down-editablearrow-downarrow_leftarrow-right-bluearrow-right-dark-bluearrow-right-greenarrow-right-greyarrow-right-orangearrow-right-whitearrow-right-bluearrow-up-orangeavatarcalendarchevron-down consultant-pathologist-nurseconsultant-pathologistcrosscrossdownloademailexclaimationfeedbackfiltergraph-arrowinterviewslinkmdt_iconmenumore_dots nurse-consultantpadlock patient-advocate-pathologistpatient-consultantpatientperson pharmacist-nurseplay_buttonplay-colour-tmcplay-colourAsset 1podcastprinter scenerysearch share single-doctor social_facebooksocial_googleplussocial_instagramsocial_linkedin_altsocial_linkedin_altsocial_pinterestlogo-twitter-glyph-32social_youtubeshape-star (1)tick-bluetick-orangetick-red tick-whiteticktimetranscriptup-arrowwebinar Sponsored Department Location NEW TMM Corporate Services Icons-07NEW TMM Corporate Services Icons-08NEW TMM Corporate Services Icons-09NEW TMM Corporate Services Icons-10NEW TMM Corporate Services Icons-11NEW TMM Corporate Services Icons-12Salary £ TMM-Corp-Site-Icons-01TMM-Corp-Site-Icons-02TMM-Corp-Site-Icons-03TMM-Corp-Site-Icons-04TMM-Corp-Site-Icons-05TMM-Corp-Site-Icons-06TMM-Corp-Site-Icons-07TMM-Corp-Site-Icons-08TMM-Corp-Site-Icons-09TMM-Corp-Site-Icons-10TMM-Corp-Site-Icons-11TMM-Corp-Site-Icons-12TMM-Corp-Site-Icons-13TMM-Corp-Site-Icons-14TMM-Corp-Site-Icons-15TMM-Corp-Site-Icons-16TMM-Corp-Site-Icons-17TMM-Corp-Site-Icons-18TMM-Corp-Site-Icons-19TMM-Corp-Site-Icons-20TMM-Corp-Site-Icons-21TMM-Corp-Site-Icons-22TMM-Corp-Site-Icons-23TMM-Corp-Site-Icons-24TMM-Corp-Site-Icons-25TMM-Corp-Site-Icons-26TMM-Corp-Site-Icons-27TMM-Corp-Site-Icons-28TMM-Corp-Site-Icons-29TMM-Corp-Site-Icons-30TMM-Corp-Site-Icons-31TMM-Corp-Site-Icons-32TMM-Corp-Site-Icons-33TMM-Corp-Site-Icons-34TMM-Corp-Site-Icons-35TMM-Corp-Site-Icons-36TMM-Corp-Site-Icons-37TMM-Corp-Site-Icons-38TMM-Corp-Site-Icons-39TMM-Corp-Site-Icons-40TMM-Corp-Site-Icons-41TMM-Corp-Site-Icons-42TMM-Corp-Site-Icons-43TMM-Corp-Site-Icons-44TMM-Corp-Site-Icons-45TMM-Corp-Site-Icons-46TMM-Corp-Site-Icons-47TMM-Corp-Site-Icons-48TMM-Corp-Site-Icons-49TMM-Corp-Site-Icons-50TMM-Corp-Site-Icons-51TMM-Corp-Site-Icons-52TMM-Corp-Site-Icons-53TMM-Corp-Site-Icons-54TMM-Corp-Site-Icons-55TMM-Corp-Site-Icons-56TMM-Corp-Site-Icons-57TMM-Corp-Site-Icons-58TMM-Corp-Site-Icons-59TMM-Corp-Site-Icons-60TMM-Corp-Site-Icons-61TMM-Corp-Site-Icons-62TMM-Corp-Site-Icons-63TMM-Corp-Site-Icons-64TMM-Corp-Site-Icons-65TMM-Corp-Site-Icons-66TMM-Corp-Site-Icons-67TMM-Corp-Site-Icons-68TMM-Corp-Site-Icons-69TMM-Corp-Site-Icons-70TMM-Corp-Site-Icons-71TMM-Corp-Site-Icons-72